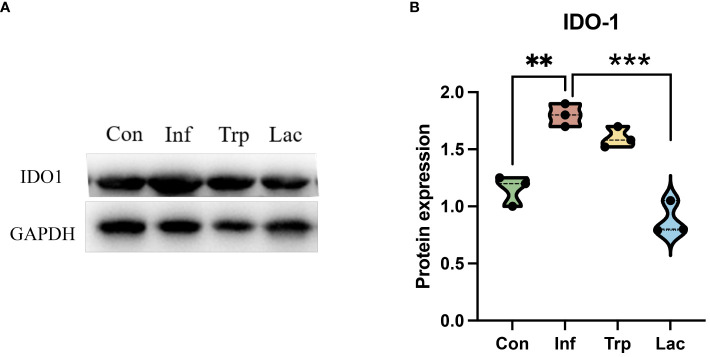
Figure 11.
The expression of IDO1 in the intestine. (A) Western blot results for IDO1; (B) Statistical results of IDO1 expression levels in four groups. Protein expression = IDO1 protein level / GAPDH protein level. Each dot represents data from one animal. Data are mean ± SEM. n = 3. Con: Female BALB/c mice aged 6 to 7 weeks (20 ± 2 g) were treated with PBS; Inf group: Female BALB/c mice aged 6 to 7 weeks (20 ± 2 g) were mice treated with influenza virus infection; Trp group: Female BALB/c mice aged 6 to 7 weeks (20 ± 2 g) were treated with exogenous tryptophan supplement; Lac group: Female BALB/c mice aged 6 to 7 weeks (20 ± 2 g) were treated with exogenous Lactobacillus supplement. Statistical analysis was performed by independent samples T test. **P < 0.01; ***P < 0.001. All replicates are biological.

