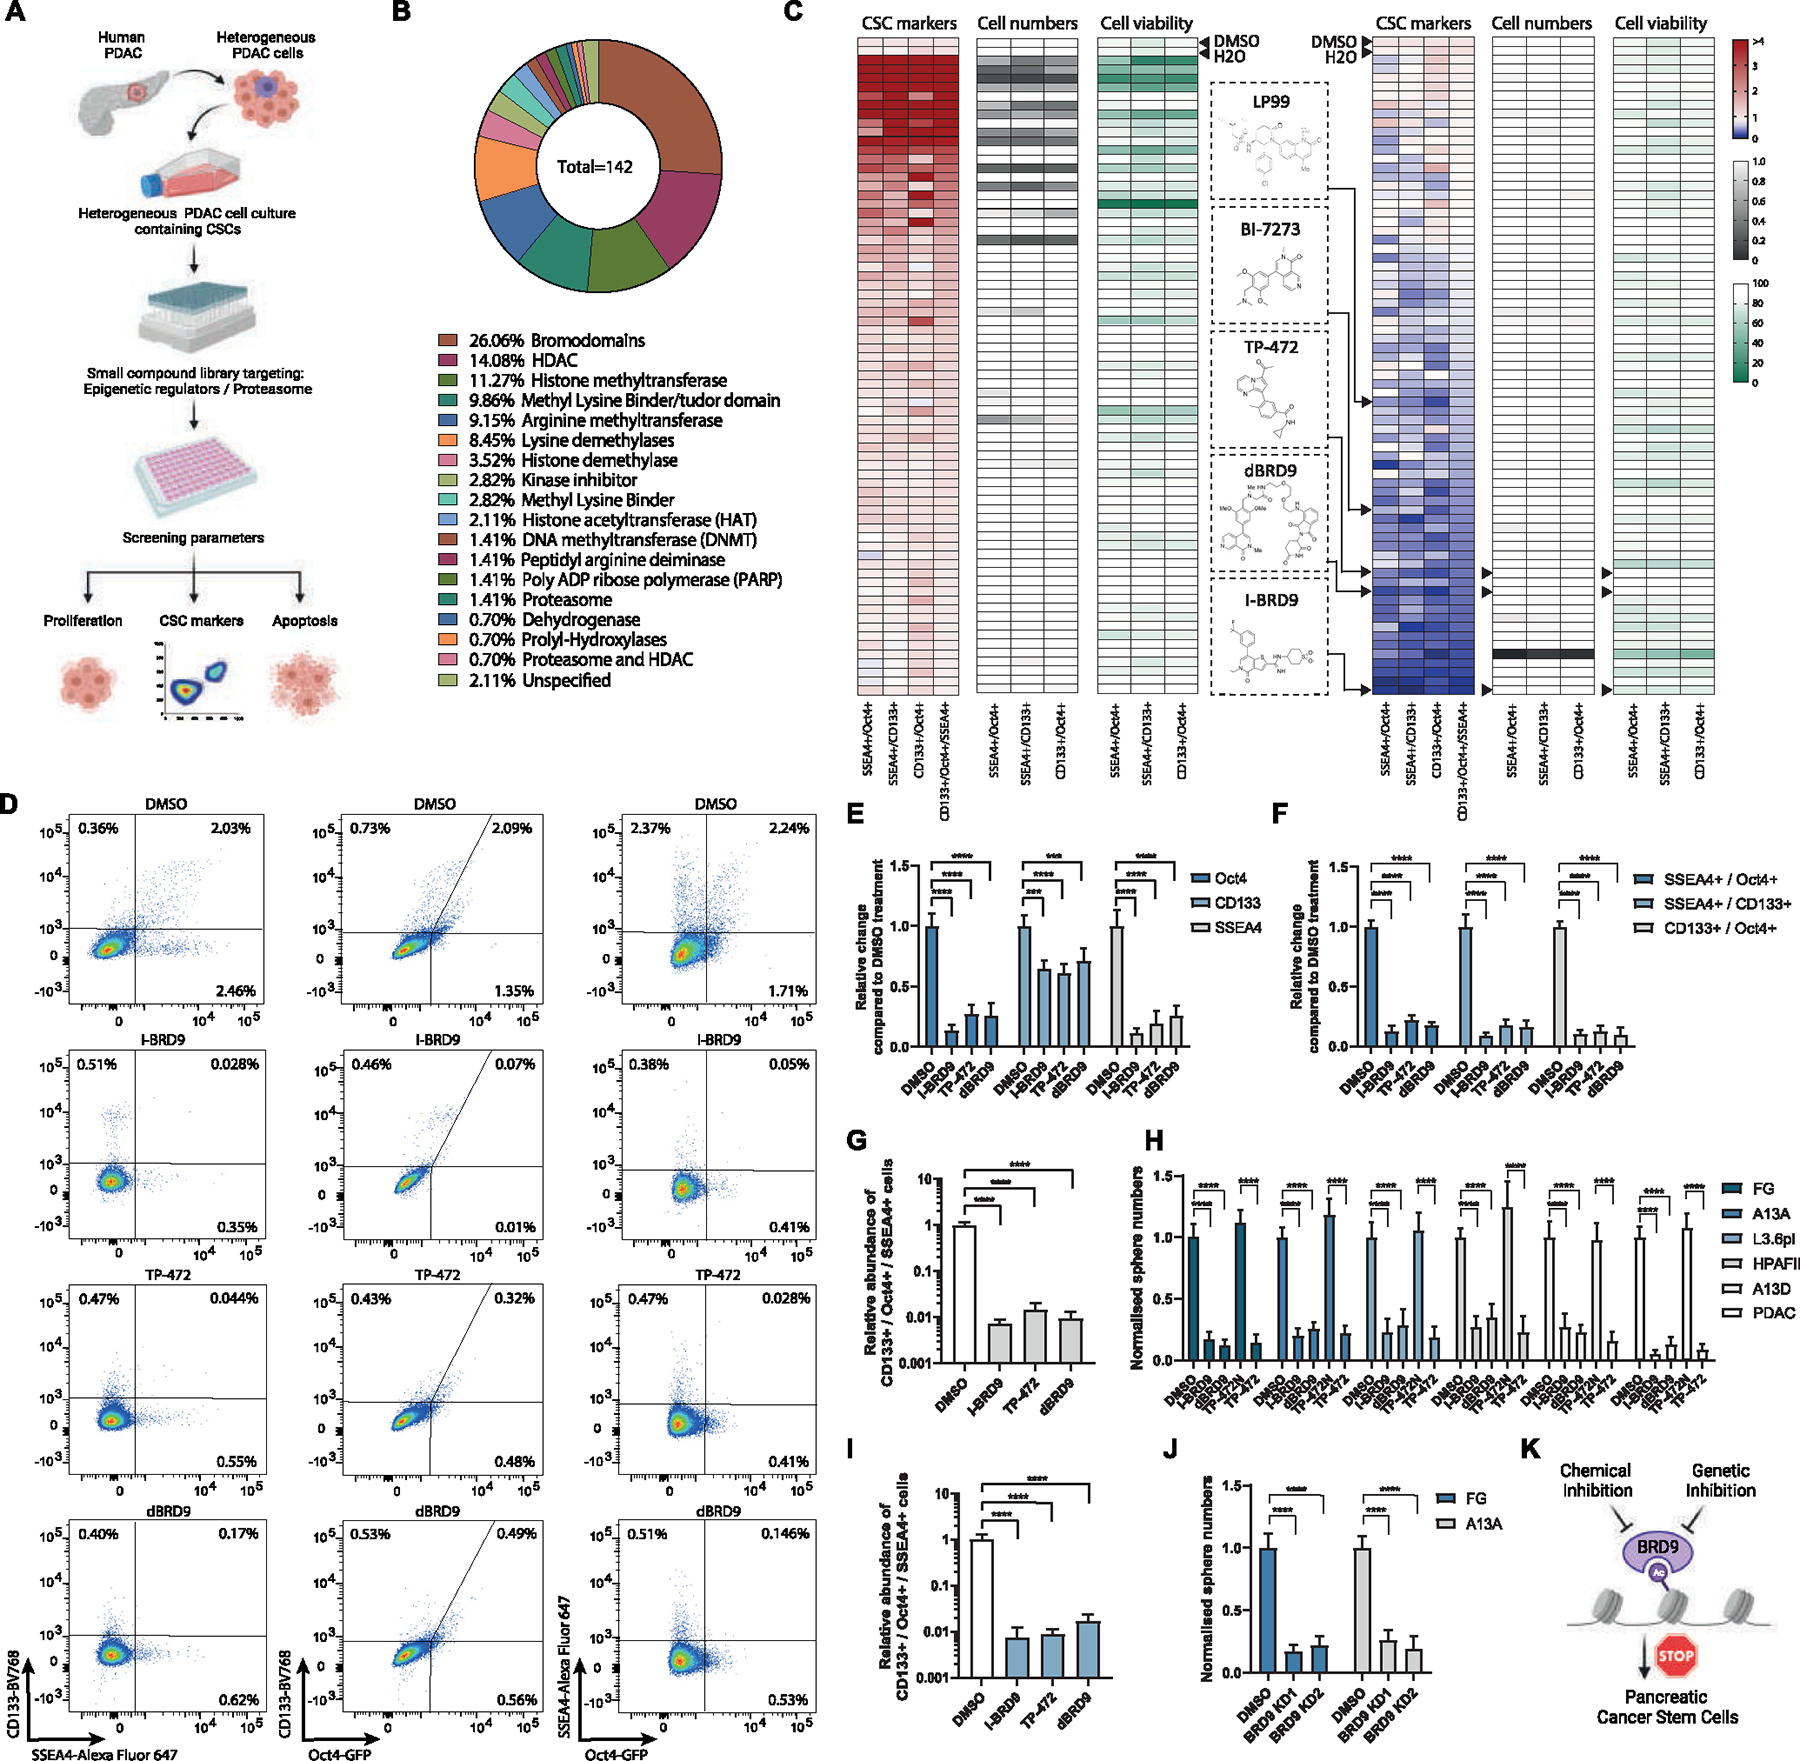
Figure 1.

Chemical screening identifies BRD9 as a regulator of pancreatic CSCs. (A) Schematic depiction of the small molecule compound screening process on pancreatic cancer cells. (B) The classification of the compound library based on the percentage of the 142 compounds belonging to each class of enzymes they target. (C) BRD9 inhibitors decrease the relative number of cells that express CSC markers OCT4-GFP, CD133, and SSEA4 as double-positive cells or triple-positive cells. Heat maps of chemical screening depicting the relative change in the expression of CSC markers, cell numbers, and cell viability. (D) BRD9 inhibitors reduce the percentage of OCT4-GFP, CD133, and SSEA4 double-positive cells. (E–G) BRD9 chemical inhibitors reduce OCT4-GFP, CD133, and SSEA4 marker expression in pancreatic cancer cells. The relative change in single CSC marker-positive (E), double-positive (F), and triple-positive cells compared with control DMSO treatments (G). (H) BRD9 inhibition reduces CSC self-renewal in different PDAC cell lines and PDAC cells from surgically resected tumor. (I) The relative decrease in OCT4-GFP+/CD133+/SSEA4+ cancer cells by BRD9 inhibition in L3.6pl PDAC cell line. (J) BRD9 KD reduces CSC self-renewal in PDAC cell lines. (K) Schematic depiction of the effects of BRD9 inhibition in CSCs. Experiments represent 3 replicates. Statistical analysis was performed by 2-way analysis of variance with multiple comparisons with Tukey correction. ****Adjusted P < .0001, ***adjusted P < .001, **adjusted P < .01, *adjusted P < .05.
