Figure 4.

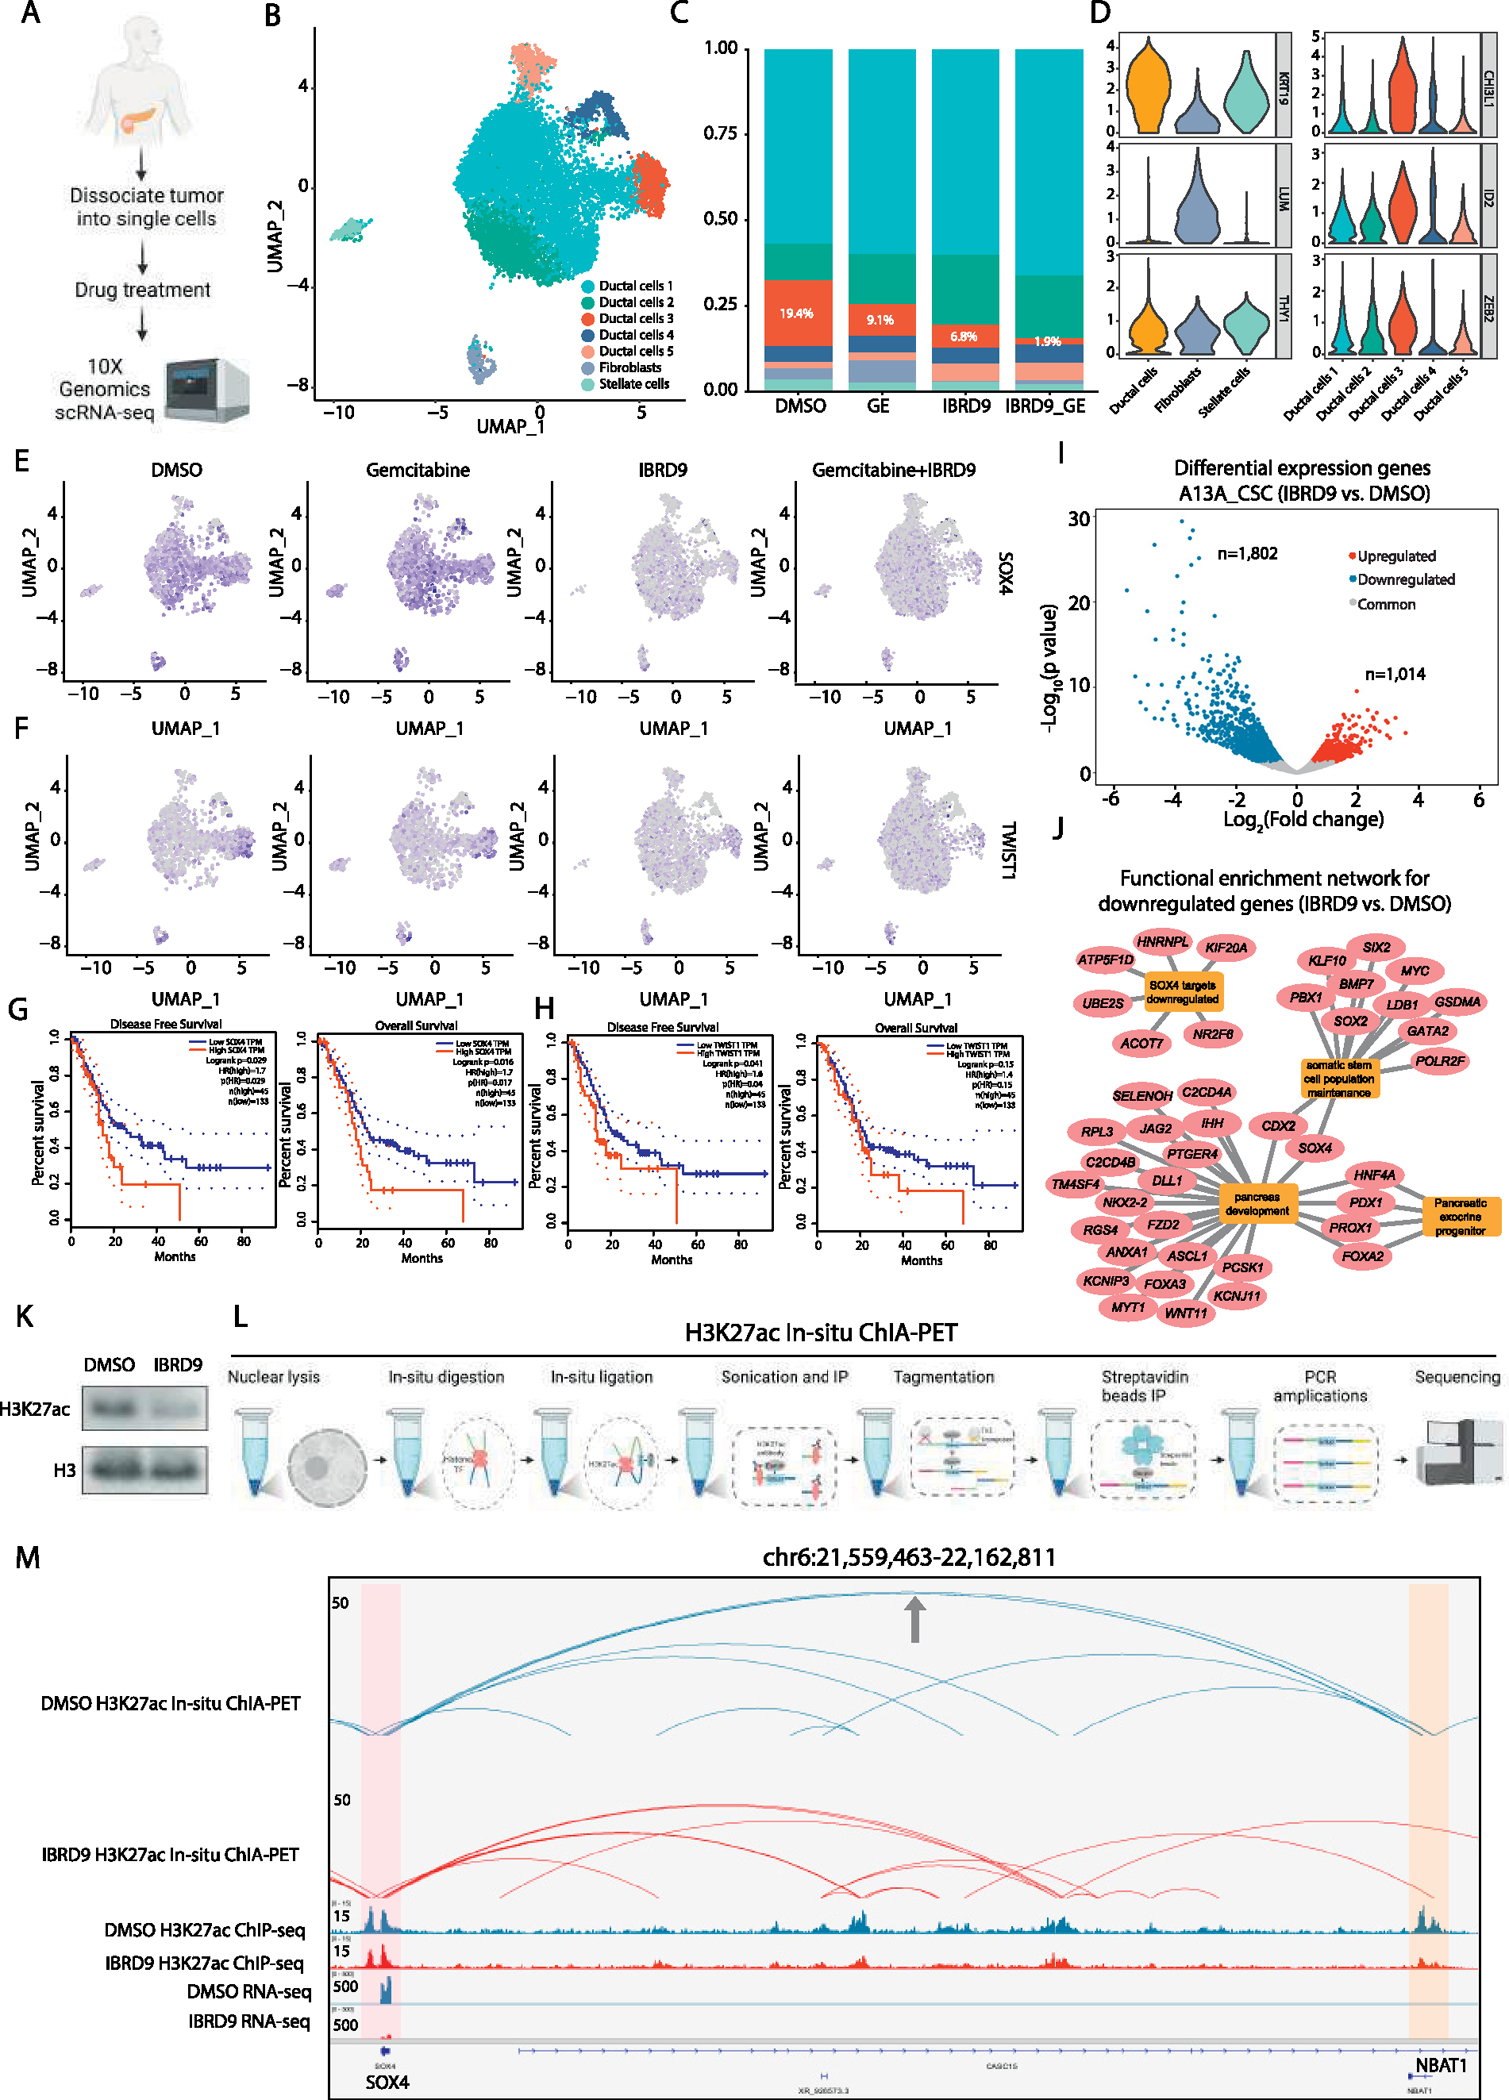
Inhibition of BRD9 reduces CSCs in patient tumors and the enhancer-promoter connectome in CSCs. (A) Schematic depiction of single-cell RNA-sequencing strategy. (B) Single-cell RNA-sequencing analyses of patient-derived primary PDAC cells with clustering of cells. (C) BRD9 inhibition reduces the relative abundance of stem cell–like cells and enhances the effects of gemcitabine. (D) Violin plots corresponding to marker gene expression in the different cell types in clusters. (E and F) BRD9 inhibition leads to the elimination of cells that express CSC genes (E) SOX4 and (F) TWIST1. (G and H) Higher expression of SOX4 and TWIST1 correlate with lower survival of patients with pancreatic cancer, and lower disease-free survival based on The Cancer Genome Atlas data. (I) Differential gene expression analysis on BRD9 inhibition in CSCs. (J) Functional enrichment network of downregulated genes on BRD9 inhibition. (K) BRD9 inhibition reduces the abundance of H3K27ac in CSCs. (L) Schematic depiction of analyzing enhancer-promoter connectivity by H3K27ac in situ chromatin interaction analysis with paired-end tag sequencing, H3K27ac chromatin immunoprecipitation sequencing (ChIP-seq) and RNA-sequencing (RNA-seq). (M) Genome browser view of H3K27ac loops for SOX4 genes. SOX4 promoter is highlighted in pink and NBAT1 promoter (enhancer-like) is highlighted in orange.
