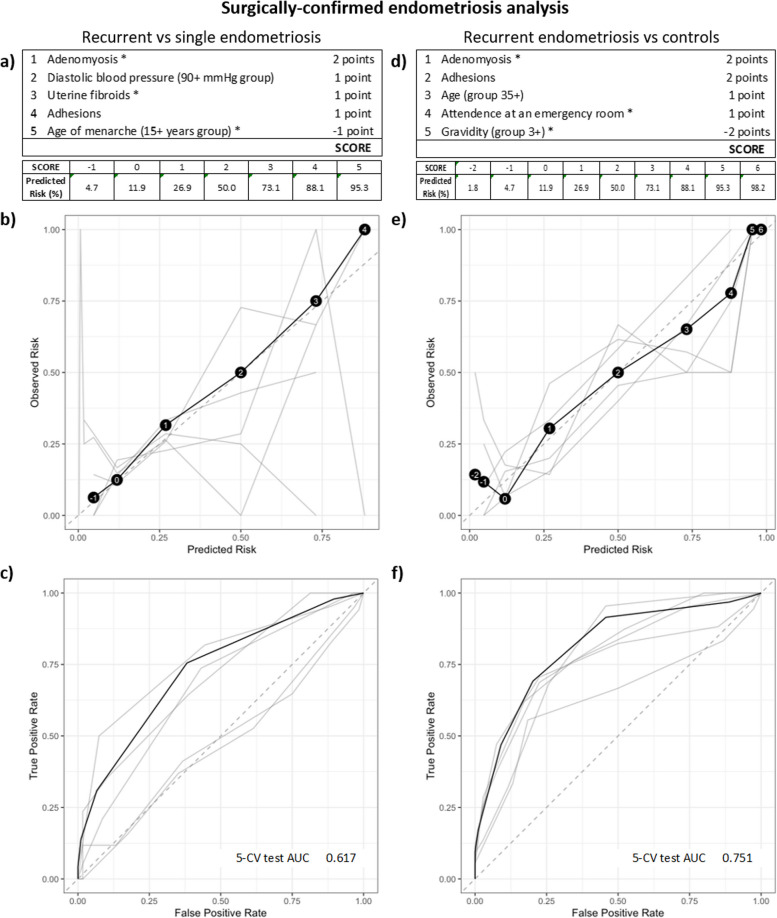
Fig. 3.
RiskSLIM scores to assess predicted risk of recurrent endometriosis in the surgically confirmed analysis group. a Tally of points and resulting scores for the various combinations of present features in the recurrent endometriosis versus single diagnosis of endometriosis comparison. Variables were selected to maximise the 5 cross-validation (CV) test AUC. The final score sat between −1 and 5, with a predicted risk of recurrence at 4.7% for a score of −1 and 95.3% for a high score of 5. d Points and scores for the recurrent endometriosis versus non-endometriosis control comparison. The final score sat between −2 and 6, with a predicted risk of recurrence at 1.8% for a score of −2 and 98.2% for a high score of 6. b and e Calibration reliability graphs with observed risk (y-axis) and predicated risk (x-axis). The final model is shown in black (with risk scores in black circles), and the 5-CV models on test data shown in grey. The 45° dashed grey line represents a perfect risk calibration. c and f Receiver operating characteristic (ROC) curve with true positive rate (y-axis) and false positive rate (x-axis). The final model is shown in black and the 5-CV models on test data shown in grey. Area under the ROC curve (AUC) for the 5-CV test and the final model are illustrated on the bottom right of the ROC curve diagram

