Fig. 3.
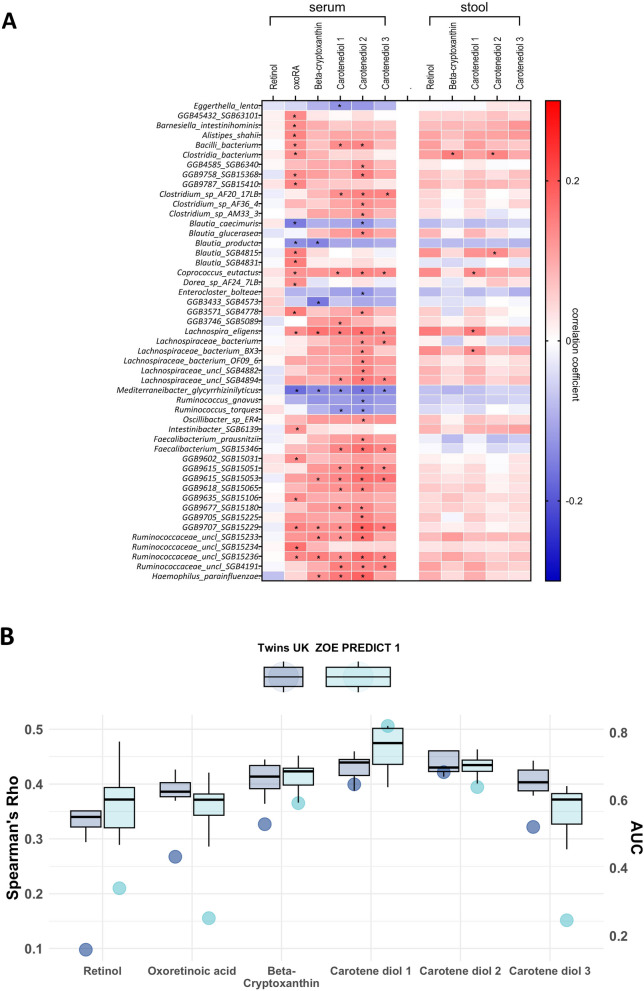
A Heatmap representing correlation of vitamin A-related metabolites from serum and gut bacterial species. Each cell of the matrix contains the regression coefficient between one vitamin A-related metabolite and a bacterial species. The table is colour-coded by correlation according to the table legend (red for positive and blue for negative correlations). * p < 0.05; ** p < 0.01; *** p < 0.001; **** p < 0.0001. B Prediction of the gut microbiota in vitamin A-related metabolites estimated by random forestregressors (using Spearman’s correlations) and classifiers (using AUC values) in TwinsUKand ZOE PREDICT-1 participants. Boxplots represent the mean AUC and the 95% confidence intervals across fivefold for TwinsUK and ZOE PREDICT-1. Dark blue and light blue circles indicate the mean of Spearman’s correlations between the real value of each vitamin A-related metabolite and the value predicted by the models across fivefold in TwinsUK and ZOE PREDICT-1

