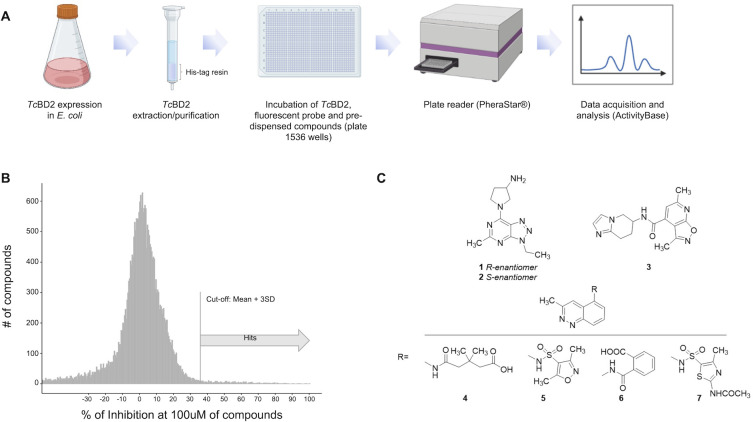
Fig 2.
HTS assay to identify TcBD2 binders. (A) Schematic flowchart of HTS assay. (B) Histogram representing 28,251 compounds assayed in a single-shot format using 1,538 grainer plates. All compounds were tested at a final concentration of 100 mM. The cutoff to consider positive hits was set at 37% of inhibition. TcBD2 was used as positive (100% fluorescent probe bound to the BD) and TcBD2m as negative (100% fluorescent probe non-bound to BD). Z’ score was used as the quality control parameter where only plates with Z’ score of above 0.4 were considered for analysis. (C) Structures of hits with pIC50 ≥ 4.5 resulting from the seriated dilutions screening of the 350 selected compounds (all compounds were >90% purity). Figure 2A was created with Bio-Render.com.

