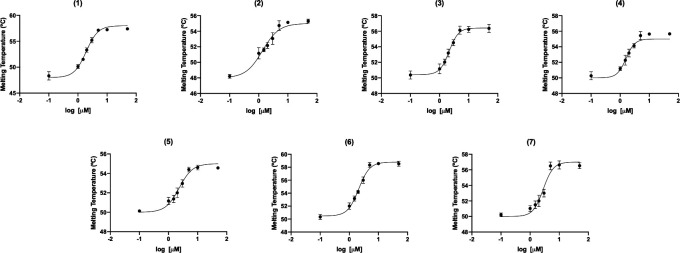
Fig 3.
Kd calculation using DSF. Six concentrations of each compound (compounds named 1 to 7 indicated on top of each graph) were used (from 0.1 to 50 µM), and the melting temperatures of TcBD2 with each concentration of compound obtained were used to calculate the Kds. DMSO was used as a control sample. All thermal shift assays were performed at least in triplicate with reproducibility of parameters within ±10%. The change of melting temperature versus the log of the ligand concentration was plotted and fitted as described in the Materials and Methods section.

