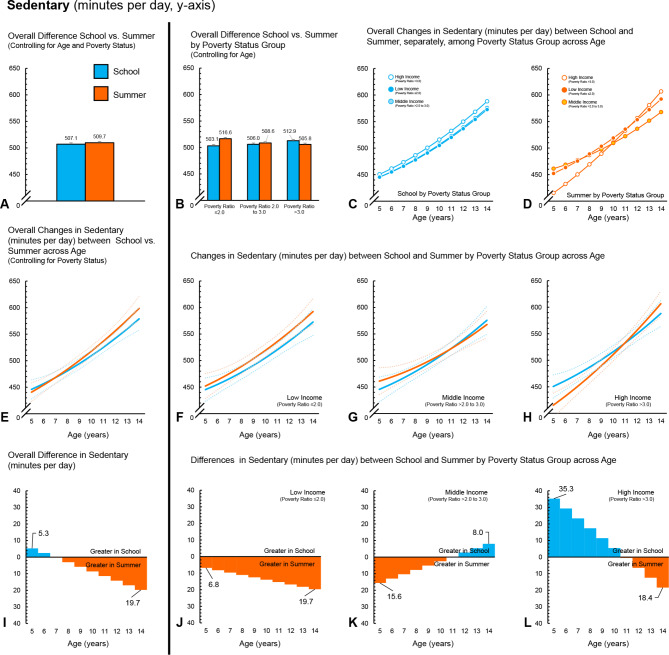
Fig. 4.
Girls (n = 585) – Time spent sedentary (minutes per day) during school and summer comparisons. (A) Comparison of overall average minutes per day between school and summer, controlling for age and ratio of income to poverty. (B) Comparison of overall average minutes per day between school and summer, controlling for age, among ratio of income to poverty groups. (C) Changes in minutes per day across age (years) during school among ratio of income to poverty groups. (D) Changes in minutes per day across age (years) during summer among ratio of income to poverty groups. (E) Overall changes in minutes per day across age (years) between school and summer, controlling for ratio of income to poverty (dotted lines represent 95% confidence intervals). (F) Changes in minutes per day across age (years) between school and summer for children in the low-income group (dotted lines represent 95% confidence intervals). (G) Changes in minutes per day across age (years) between school and summer for children in the middle-income group (dotted lines represent 95% confidence intervals). (H) Changes in minutes per day across age (years) between school and summer for children in the high-income group (dotted lines represent 95% confidence intervals). (I) *Overall differences, by age, in minutes per day between school and summer, controlling for ratio of income to poverty. (J) *Differences, by age, in minutes per day between school and summer, for children in the low-income group. (K) *Differences, by age, in minutes per day between school and summer, for children in the middle-income group. (L) *Differences, by age, in minutes per day between school and summer, for children in the high-income group. *Panels I, J, K and L ORANGE represents greater minutes per day during summer compared to school at a given age; BLUE represents greater minutes per day during school compared to summer at a given age

