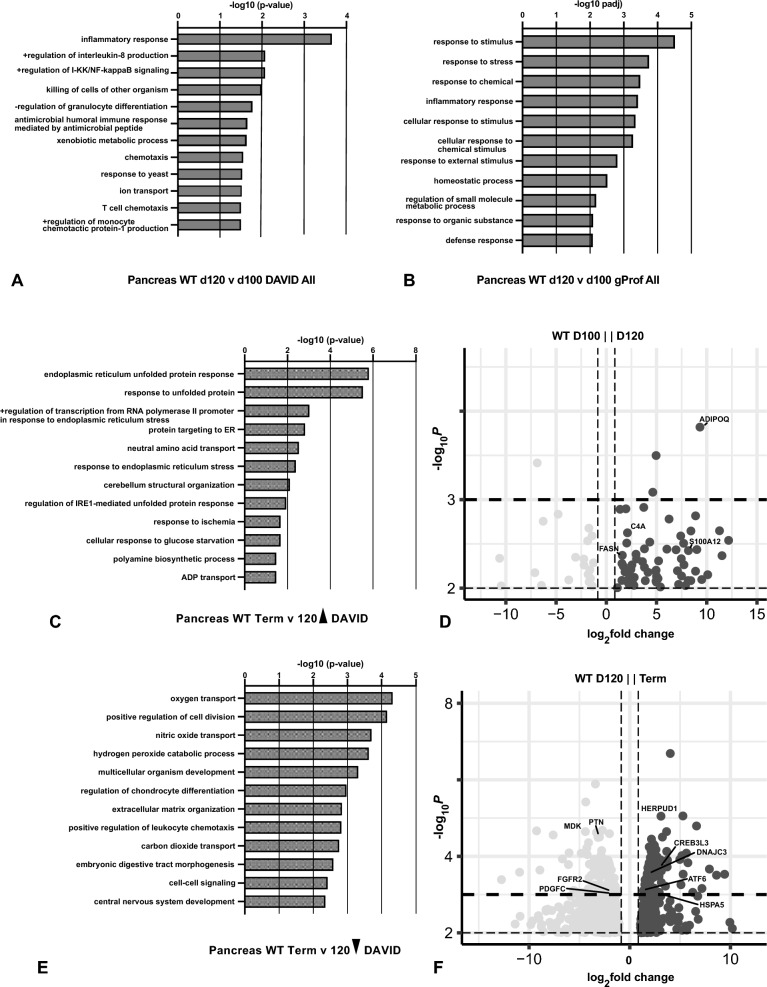
Fig. 1.
Gene ontology process enrichment analyses of differentially expressed genes between gestational time points in WT sheep pancreas. Differentially expressed genes (DEGs) were filtered to enrich for genes with a fold change ≥ ± 1.5 and Benjamini–Hochberg adjusted p-value ≤ 0.01 for all samples except term where a p-value of ≤ 0.001 was used. Gene ontology analysis by DAVID (A, C, D) or gProfiler (B) and up to the top 20 biological processes (BP) are shown. A, B, BP from all DEGs (20 downregulated and 61 upregulated) at 120 days compared to 100 days; C BP from genes (399) upregulated at term compared to 120 days; E BP from genes (656) downregulated at term compared to 120 days. D, F Volcano plots (− log10 p-value against log2 fold change) show DEGs between WT pancreas tissue at (D) 100 days and 120 days, and (F) 120 days and term. Genes noted in the results are marked

