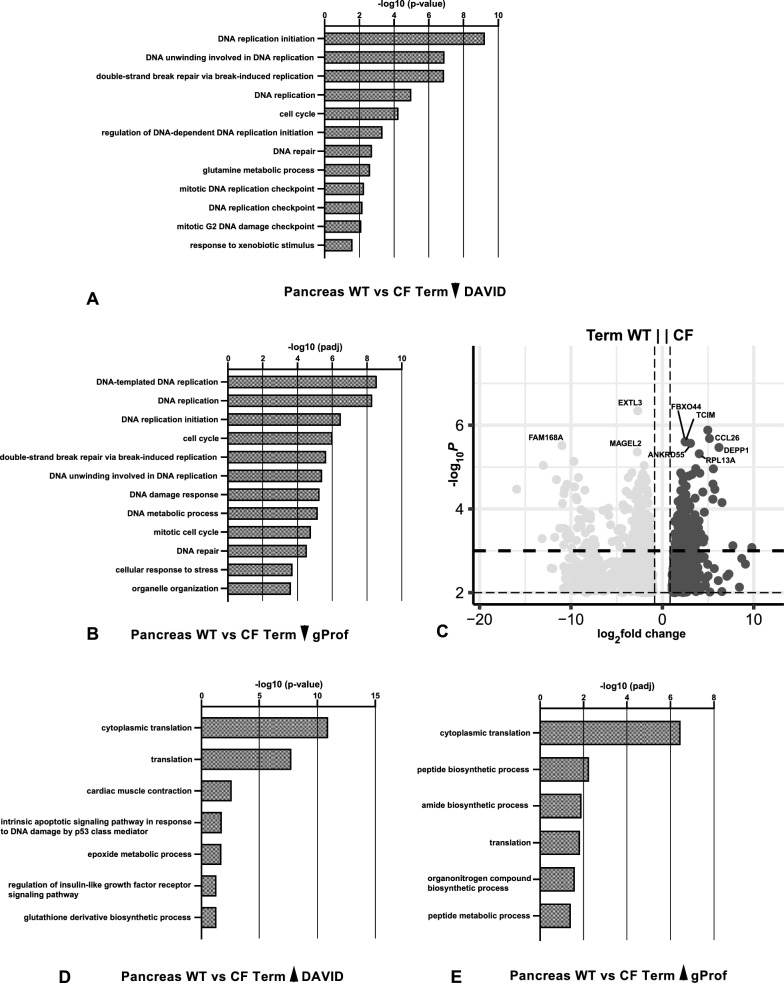
Fig. 4.
Gene ontology process enrichment analyses of differentially expressed genes between WT and CFTR−/− sheep pancreas at individual gestational time points. Differentially expressed genes (DEGs) were filtered to enrich for genes with a fold change ≥ ± 1.5 and Benjamini–Hochberg adjusted p-value ≤ 0.001 for all samples. Gene ontology analysis by DAVID (A, D) or gProfiler (B, E) and up to the top 20 biological processes (BP) are shown. A, B BP from genes (246) downregulated in CFTR−/− compared to WT at term; D, E BP from genes (183) upregulated in CFTR−/− compared to WT at term. C Volcano plot (− log10 p-value against log2 fold change) shows DEGs between CFTR−/− compared to WT at term with a p-value ≤ 0.01 (936 genes downregulated and 717 upregulated)

