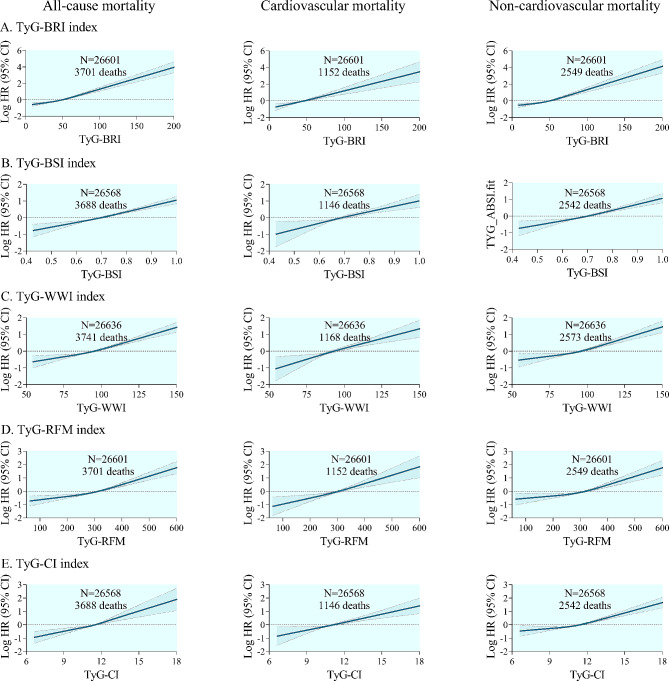
Fig. 6.
Restricted cubic spline curve for the association of other TyG-derived indices with all-cause and cause-specific mortality. All-cause and cause-specific mortality for A TyG-BRI index, B TyG-BSI index, C TyG-WWI index, D TyG-RFM index, and E TyG-CI index. Solid lines represent hazard ratios, and dashed lines represent 95% confidence intervals. Adjusted for age, sex, ethnicity, BMI, systolic blood pressure, smoking status, alcohol consumption, diabetes mellitus, ASCVD, COPD, chronic heart failure, chronic renal disease, cancer, total cholesterol, HDL-C, LDL-C, albumin, eGFR, statin use, and insulin or antihyperglycemic drugs. BRI body roundness index, BSI body shape index, WWI weight-adjusted-waist index, RFM relative fat mass, CI conicity index

