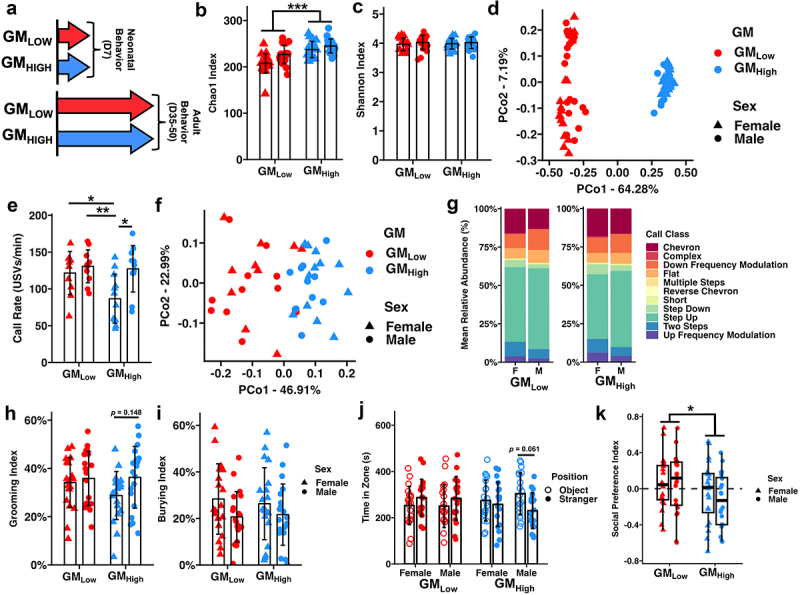
Figure 1.

Standardized complex microbiomes selectively affect male asd-related behavior.
(a) Graphical representation of experimental design depicting cohorts of neonatal (n = 10-12 mice/sex/GM) and adult (n = 20 mice/sex/GM) BTBR mice.
(b) Dot plot depicting Chao-1 Index. ***pGM < 0.001, pSex = 0.002, Two-way ANOVA
(c) Dot plot depicting Shannon Index. pGM = 0.867, pSex = 0.276, Two-way ANVOA
(d) Principal coordinate analysis depicting Bray-Curtis dissimilarity between microbial communities. pGM < 0.001, pSex = 0.063, Two-way PERMANOVA.
(e) Dot plot depicting USV rate. *p < .05, **p < .01, Tukey post hoc.
(f) Principal coordinate analysis depicting Bray-Curtis dissimilarity of the relative abundance of ultrasonic vocalizations. pGM = 0.001, pSex = 0.044, Two-way PERMANOVA.
(g) Stacked bar charts depicting mean relative abundance of call types determined by VocalMat.
(h) Dot plot depicting Grooming Index. pGM = 0.321, pSex = 0.069, Two-way ANVOA.
(i) Dot plot depicting Burying Index. pGM = 0.862 pSex = 0.048, Two-way ANOVA.
(j) Dot plot depicting time spent in Stranger (closed circles) or Object (open circles) chambers of social preference test.
(k) Tukey box plot depicting Social Preference Index. *pGM = 0.044, pSex = 0.498, Two-way ANOVA.
