
Figure 3.
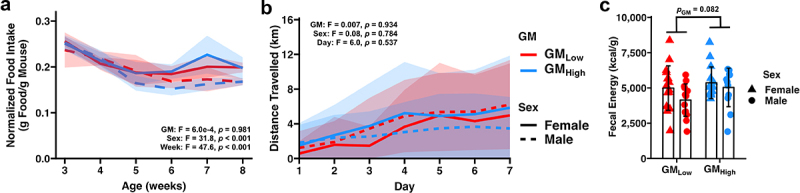
Standardized complex microbiomes may affect energy harvest in the gut.
(a) Line plot depicting feed efficiency observed in GMLow and GMHigh BTBR mice. Bold line represents average feed efficiency. Ribbon represents standard deviation. Inset depicts three-way ANOVA results.
(b) Line plots depicting distance traveled by GMLow and GMHigh BTBR mice. Bold line represents average distance traveled. Ribbon represents standard deviation. Inset depicts three-way ANOVA results.
(c) Dot plot depicting time fecal energy as determined by bomb calorimetry. pGM = 0.082, pSex = 0.093, Two-way ANOVA.