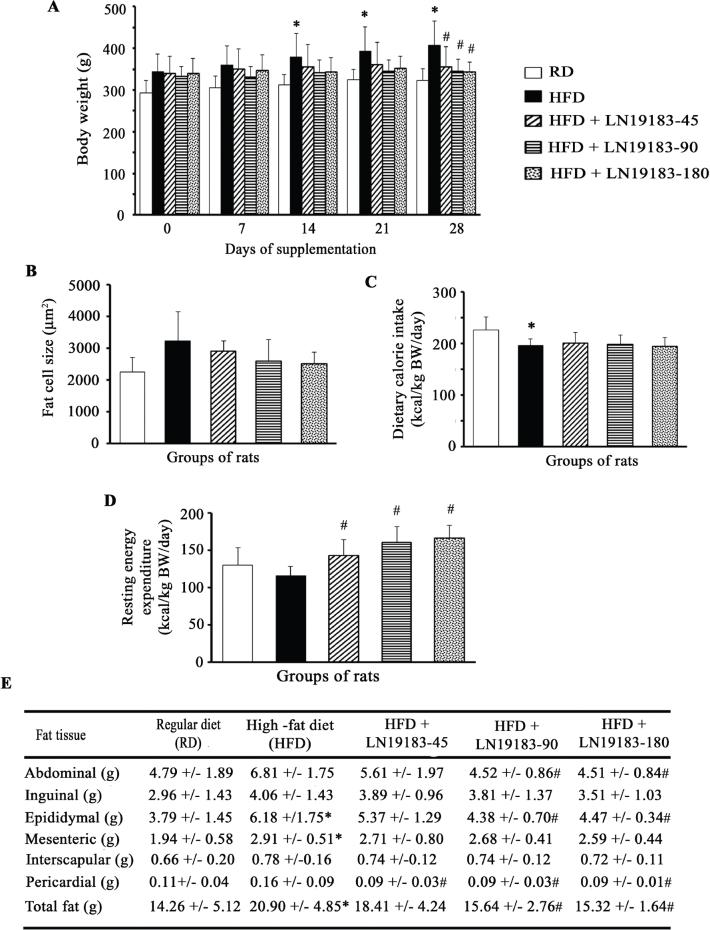
Fig. 1.
(A) The bar graph shows changes in body weights of the experimental rats. Body weights (BW) are measured weekly. The rats received either a regular diet (RD) or a high-fat diet (HFD) or HFD in combination with a daily dose of 45 mg/kg (LN19183-45), 90 mg/kg (LN19183-90), or 180 mg/kg (LN19183-180) of LN19183, as described in the Materials and Methods. (B) Each bar presents the mean ± SD of area (μm2) of the epididymal fat cells in the experimental groups of rats. The bar graphs (C) and (D) present daily dietary calorie intake (kcal per kg BW) and resting energy expenditure (kcal per kg BW) by the groups of rats as indicated. (E) The table presents the total body fat and regional fat masses in the rats of the experimental groups. Data present as mean ± SD; n = 8.
*, and # indicate significance (P < 0.05) in RD vs. HFD, and HFD vs. LN19183-supplemented rats, respectively, using ANOVA with suitable post-hoc test.

