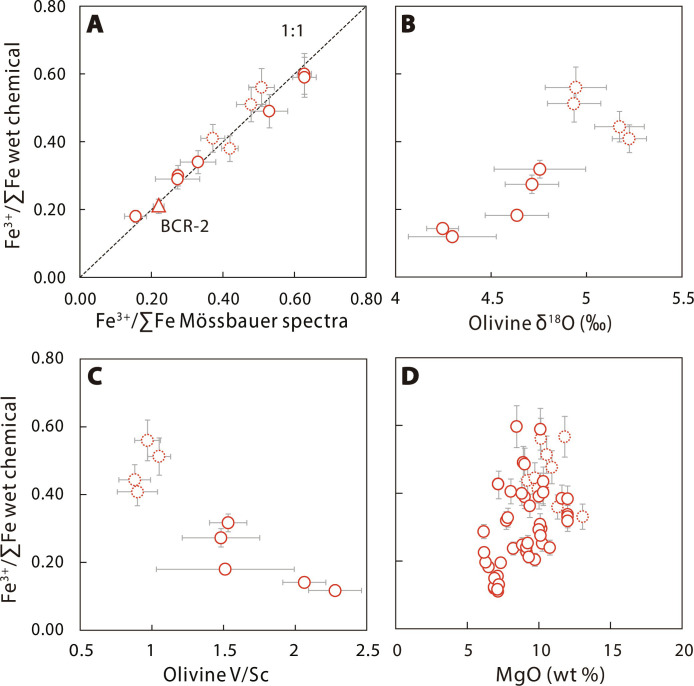
Fig. 2. Fe3+/∑Fe values of Cenozoic intraplate basalts from EC.
Wet chemistry Fe3+/∑Fe values versus MBS Fe3+/∑Fe values (A), olivine δ18O (B), olivine V/Sc (C), and MgO (D). Wet chemistry and MBS Fe3+/∑Fe values are reported in tables S1 and S3, respectively. The triangle represents the U.S. Geological Survey basalt standard BCR-2. Error bars in (A) reflect ±10% error for wet chemistry Fe3+/∑Fe values and 1 SD for MBS Fe3+/∑Fe values. Olivine δ18O and V/Sc data are reported in table S4. Data points represent the average of analyzed olivine grains from individual EC basalts. A histogram plot of all analyzed olivine δ18O (n = 198) and a plot of δ18O versus V/Sc for all analyzed olivine grains are shown in fig. S4. Error bars in (B) and (C) represent 2 SE for olivine δ18O and V/Sc of individual samples. Samples with LOI > 3 wt % are shown in red dashed.

