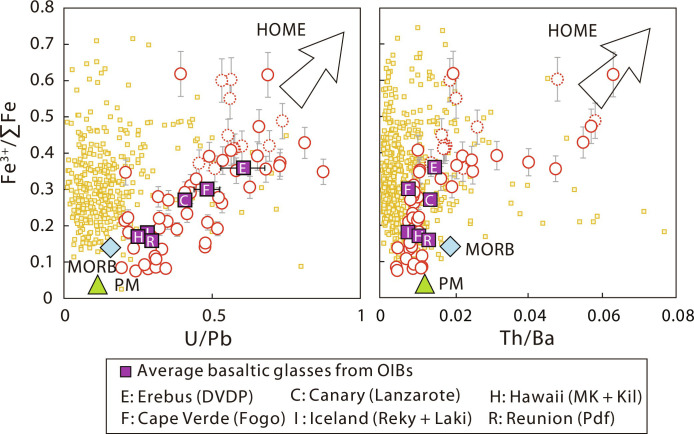
Fig. 3. Corrected Fe3+/∑Fe values versus U/Pb and Th/Ba for Cenozoic intraplate basalts from EC.
Data of EC Cenozoic intraplate basalts are shown in red circles and reported in table S1, with those with LOI > 3 wt % shown in red dashed. Fe3+/∑Fe values are corrected for olivine crystal fractionation or accumulation. Error bars represent ±10% for Fe3+/∑Fe values of EC Cenozoic intraplate basalts. Data of arc basalts are shown in yellow squares and provided in data file S2. The “most parental” Fe3+/∑Fe values of OIB from each hotspot location are compiled from Brounce et al. (19) and Moussallam et al. (2). A complete data source including Fe3+/∑Fe and average elemental compositions of OIB is provided in data file S3. Error bars represent 2 SE for OIB averages. The average Fe3+/∑Fe values of MORB and PM are from Zhang et al. (18) and Canil et al. (28), respectively. The trace element compositions of average MORB and PM are from McDonough and Sun (69). HOME, highly oxidized mantle endmember.

