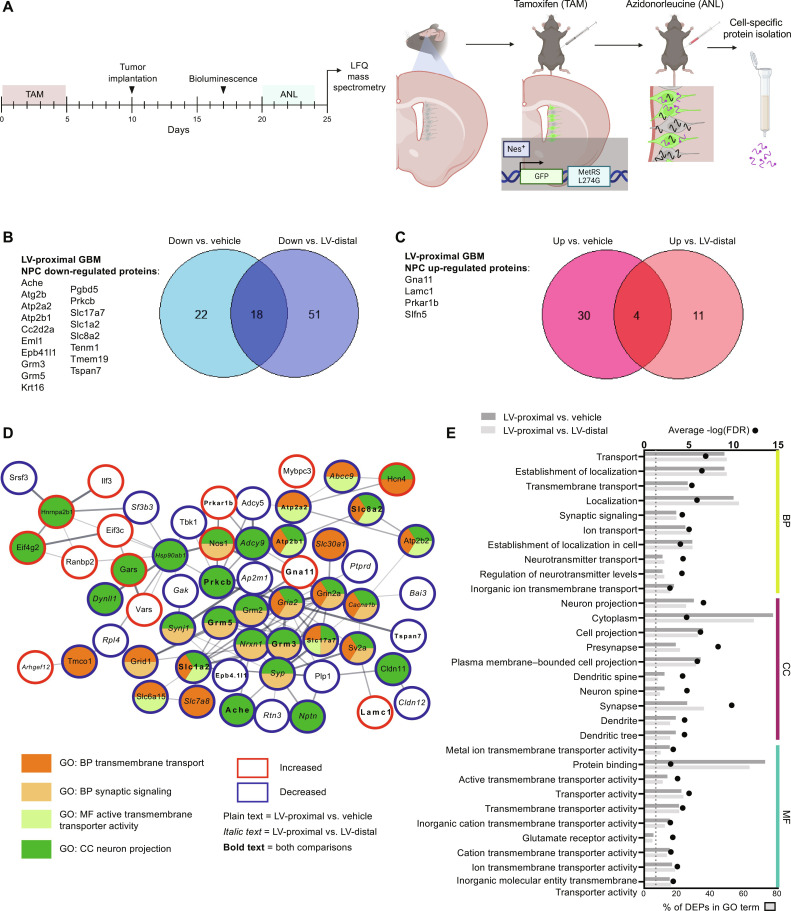
Fig. 2. Cell-specific quantitative proteomics of SVZ NPCs reveals decreased expression of neuronal maturation proteins in the presence of LV-proximal glioma.
(A) Schematic illustrating experimental timeline and methodology for Fig. 2. Created with Biorender.com. (B) Venn diagram and list of down-regulated proteins in the SVZ of LV-proximal GBM animals compared to vehicle and LV-distal GBM controls. (C) Venn diagram and list of up-regulated proteins in the SVZ of LV-proximal GBM animals compared to vehicle and LV-distal GBM controls. (D) STRING interaction network for a subset of the LV-proximal GBM-associated DEPs that belong to the indicated GO or KEGG terms or directly interact with proteins belonging to these terms. Node colors indicate protein affiliation with the indicated terms. Plain text indicates a DEP in the LV-proximal GBM versus vehicle interaction. Italic text indicates a DEP in the LV-proximal GBM group versus LV-distal GBM group. Bold text indicates the DEP overlaps between the two interactions. (E) Overlapping GO terms between the two interaction DEPs. BP, biological process; CC, cellular compartment; MF, molecular function.

