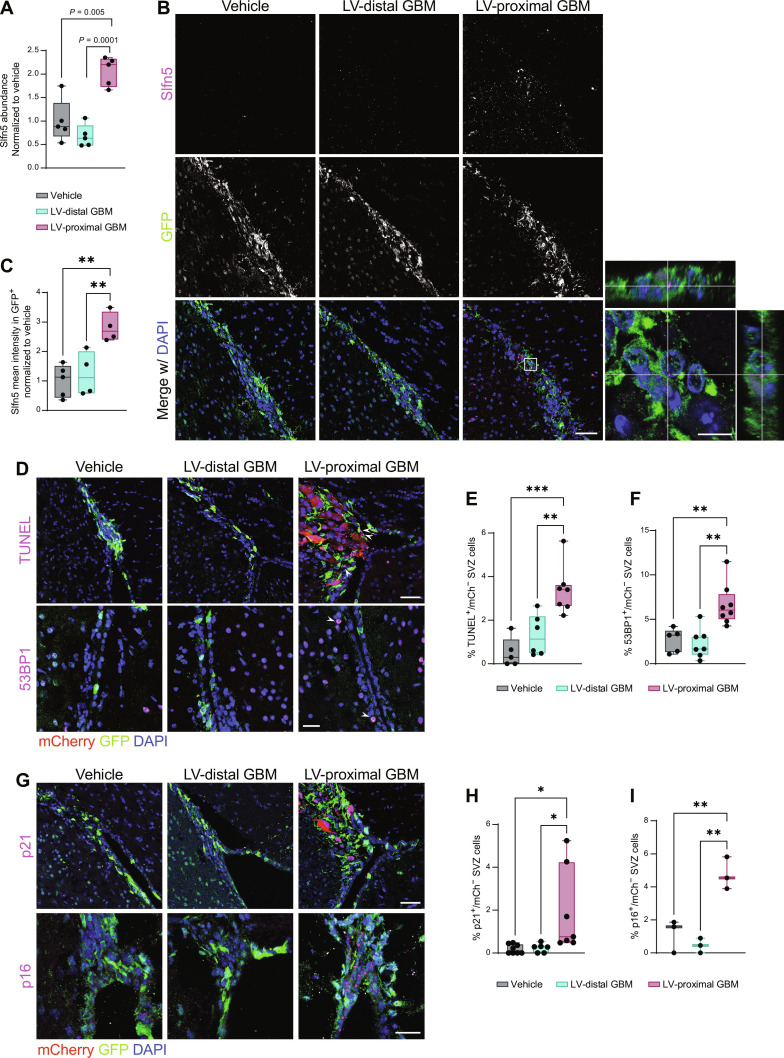
Fig. 3. LV-proximal GBM induces increased DNA damage and senescence in SVZ NPCs.
(A) LFQ proteomic results for Slfn5 quantification (n = 5 biological replicates). Normalized to vehicle group. Data were compared with one-way ANOVA with false discovery rate (FDR) correction. (B) Representative immunofluorescent images of increased Slfn5+ in GFP+ cells of the LV-proximal GBM SVZ. Scale bar, 25 μm. White box indicates where inset on right is taken, showing Slfn5+ puncta within GFP+ cells. Scale bar for inset, 10 μm. (C) Slfn5+ mean intensity quantification in GFP+ cells via immunofluorescence (n = 4 to 5 biological replicates). Normalized to vehicle group. Data were compared via ordinary one-way ANOVA with Tukey multiple comparisons. (D) Representative immunofluorescence images of increased TUNEL+ cells (top) and increased 53BP1+ cells (bottom) in LV-proximal GBM SVZ. Scale bar, 50 μm for TUNEL images and 25 μm for 53BP1 images. White arrows indicate DNA damage+/mCh− nuclei. (E) Quantification of percentage of TUNEL+ cells in SVZ (n = 5 to 7 biological replicates). Data were compared via ordinary one-way ANOVA with Tukey multiple comparisons. (F) Quantification of percentage of 53BP1+ cells in SVZ (n = 5 to 7 biological replicates). Data were compared via ordinary one-way ANOVA with Tukey multiple comparisons. (G) Representative immunofluorescence images of increased p21+ cells (top) and p16+ cells (bottom) in LV-proximal GBM SVZ. Scale bar, 50 μm for p21 images and 25 μm for p16 images. (H) Quantification of percentage of p21+ cells in SVZ (n = 5 to 7 biological replicates). Data were compared via ordinary one-way ANOVA with Tukey multiple comparisons. (I) Quantification of percentage of p16+ cells in SVZ (n = 3 biological replicates). Data were compared via ordinary one-way ANOVA with Tukey multiple comparisons. Data represented as median ± minimum/maximum; *P < 0.05, **P < 0.01, ***P < 0.001, ****P < 0.0001.

