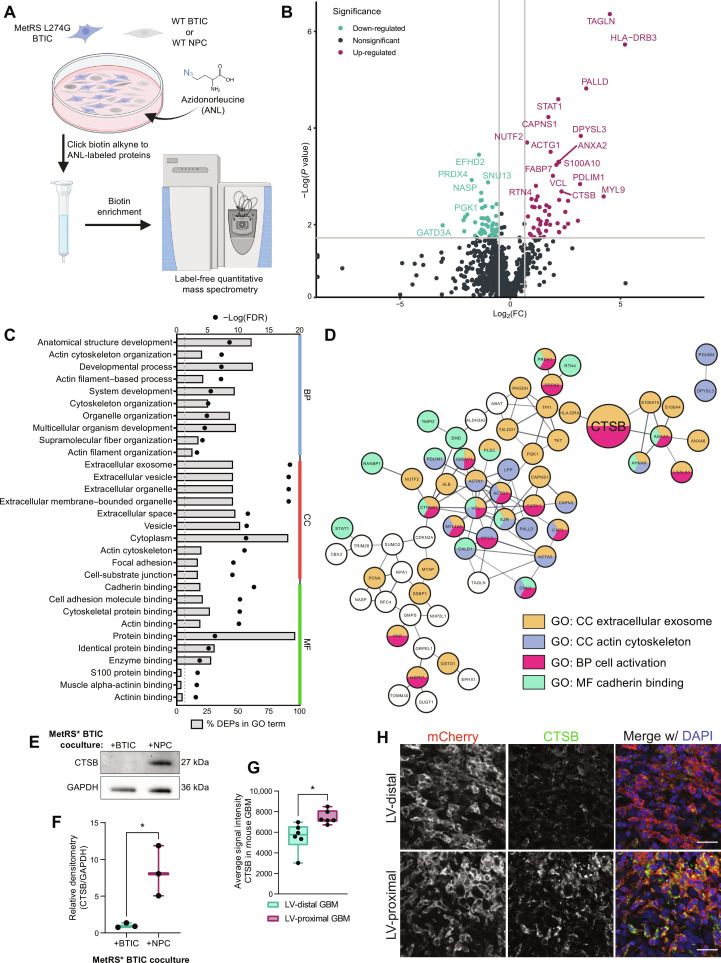
Fig. 4. BTIC coculture with hfNPCs results in GBM-specific increase in the expression of promalignancy proteins including CTSB.
(A) Schematic illustrating coculture setup. Created with Biorender.com. WT, wild-type. (B) Volcano plot of BTIC-specific proteins up-regulated and down-regulated by coculture with NPCs. Gray lines indicate fold change = 1.5 (x axis) and adjusted P value at 0.05 (y axis). (C) Top 10 GO terms in each GO category associated with DEPs from BTIC coculture proteomics. Both the percentage of DEPs (bars) and FDR (points) of terms are included. (D) STRING interaction network for a subset of the NPC coculture associated DEPs that belong to the indicated GO or KEGG terms or directly interact with proteins belonging to these terms. Node colors indicate protein affiliation with the indicated terms. CTSB highlighted by larger size. (E) Representative Western blot for CTSB in BTIC-specific proteins from control coculture and NPC coculture. Glyceraldehyde-3-phosphate dehydrogenase (GAPDH) is shown as a loading control. (F) Quantification of Western blot densitometry for GBM1A BTIC-specific CTSB normalized to GAPDH (n = 3 biological replicates). Data were compared with two-tailed unpaired t test. (G) Quantification of IHC mean intensity of CTSB within murine GBM (n = 6 biological replicates). Data were compared with two-tailed unpaired t test. (H) Representative IHC of mouse tumors showing increased CTSB in LV-proximal GBM. Scale bar, 25 μm. Data represented as median ± minimum/maximum; *P < 0.05, **P < 0.01, ***P < 0.001, ****P < 0.0001.

