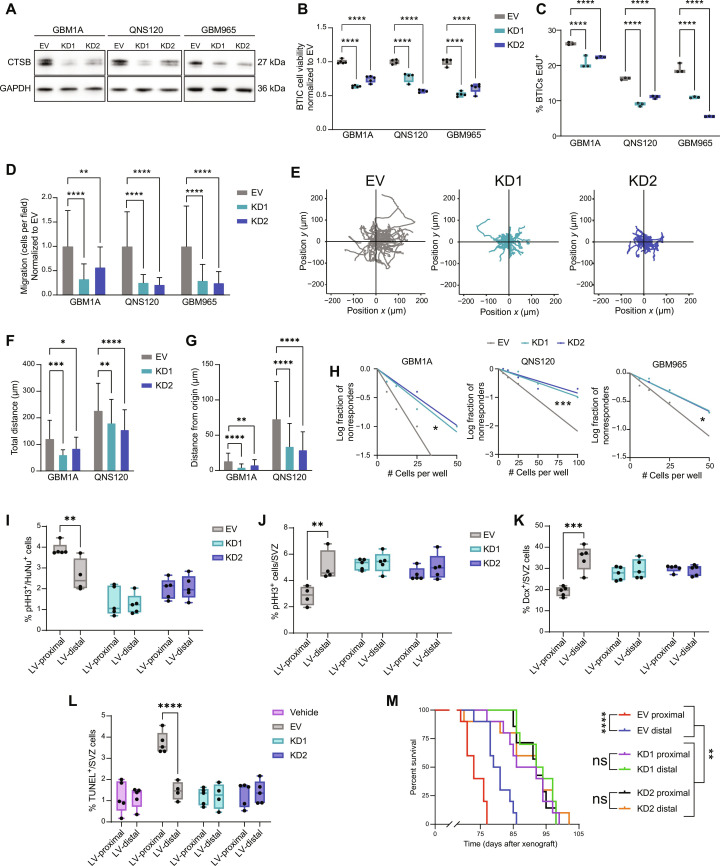
Fig. 5. Cell-intrinsic CTSB contributes to GBM malignancy and LV-proximal GBM phenotypes.
(A) Western blot confirming CTSB KD. (B) BTICs cell viability at 48 hours (n = 5 technical replicates). Normalized to EV. (C) EdU proliferation assay in EV and CTSB KD (n = 3 technical replicates). (D) Transwell migration of EV and CTSB KD. (E) Representative plots of migration from origin in QNS120 EV and CTSB KD. (F) Total distance traveled by EV and CTSB KD BTICs in time-lapse migration. (G) Distance from origin traveled by EV and CTSB KD BTICs in time-lapse migration. (H) LDA self-renewal for EV and CTSB KD. (I) Proliferation in EV and CTSB KD GBM1A tumors proximal or distal to LV (n = 4 to 5 biological replicates). (J) Proliferation in the SVZ in the presence of EV and CTSB KD GBM1A tumors proximal or distal to LV (n = 4 to 5 biological replicates). (K) Quantified Dcx+ neuroblasts in the SVZ in the presence of EV and CTSB KD GBM1A tumors proximal or distal to LV (n = 5 biological replicates). (L) Quantified TUNEL+ cells in the SVZ in the presence of PBS vehicle injection or EV and CTSB KD GBM1A tumors proximal or distal to LV (n = 4 to 5 biological replicates). (M) Kaplan-Meier curves of mice bearing EV or CTSB shRNA GBM1A tumors proximal or distal to LV (n = 7 to 10 biological replicates). Data represented as median ± maximum/minimum (box and whisker) or mean ± SD (bar charts). Data compared with two-way ANOVA, Dunnett multiple comparisons for (B), (C), (D), (F), and (G); Pearson’s chi-square test for (H); two-way ANOVA, Šídák multiple comparisons for (I) to (L); and Mantel-Cox log-rank test accounting for multiple comparisons for (M). *P < 0.05, **P < 0.01, ***P < 0.001, ****P < 0.0001. ns, not significant.

