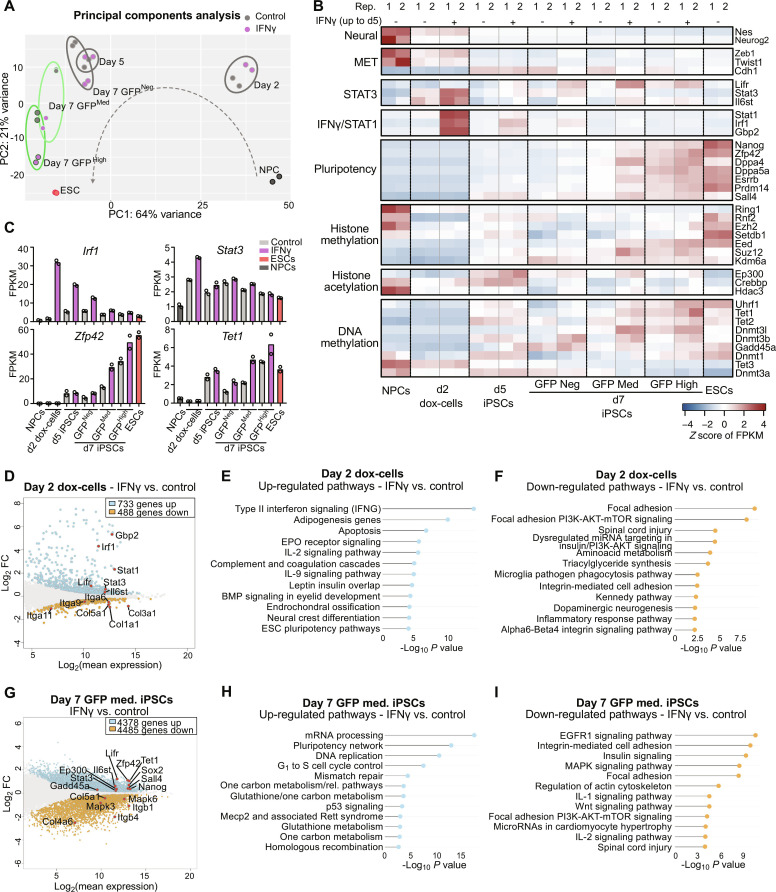
Fig. 3. IFNγ pathway activation accelerates the reprogramming process.
(A) PCA of RNA-seq of NPCs, day 2, day 5, and day 7 reprogramming populations, and ESCs, in control and IFNγ treatment (day 0 to 5), representing the top 500 most variable genes. (B) Heatmap representing expression (z score of FPKM) of neural genes, mesenchymal-to-epithelial transition (MET) genes, pluripotency genes, STAT3- and IFNγ/STAT1-related genes, histone methylation genes, histone acetylation genes, and DNA methylation genes. (C) Expression (FPKM) of selected genes (Irf1, Stat3, Zfp42/Rex1, and Tet1) in NPCs, ESCs, and day 2, day 5, and day 7 reprogramming populations ± IFNγ treatment (two RNA-seq replicates shown). (D) MA plot (log2FC vs log2 mean expression) displaying transcriptomic changes of IFNγ versus control day 2 reprogramming cells (adjusted P = 0.1). Up-regulated genes are highlighted in light blue; down-regulated genes are highlighted in orange. Selected genes are shown with points in red. (E and F) Up-regulated (E) and down-regulated (F) pathways in IFNγ versus control day 2 reprogramming cells (WikiPathways Mouse 2019) (adjusted P = 0.1). (G) MA plot displaying transcriptomic changes of IFNγ versus control day 7 X-GFP medium iPSCs (adjusted P = 0.1). Up-regulated genes are highlighted in light blue; down-regulated genes are highlighted in orange. Selected genes are shown with points in red. (H and I) Up-regulated (H) and down-regulated (I) pathways in IFNγ versus control day 7 X-GFP medium iPSCs (WikiPathways Mouse 2019) (adjusted P = 0.1).

