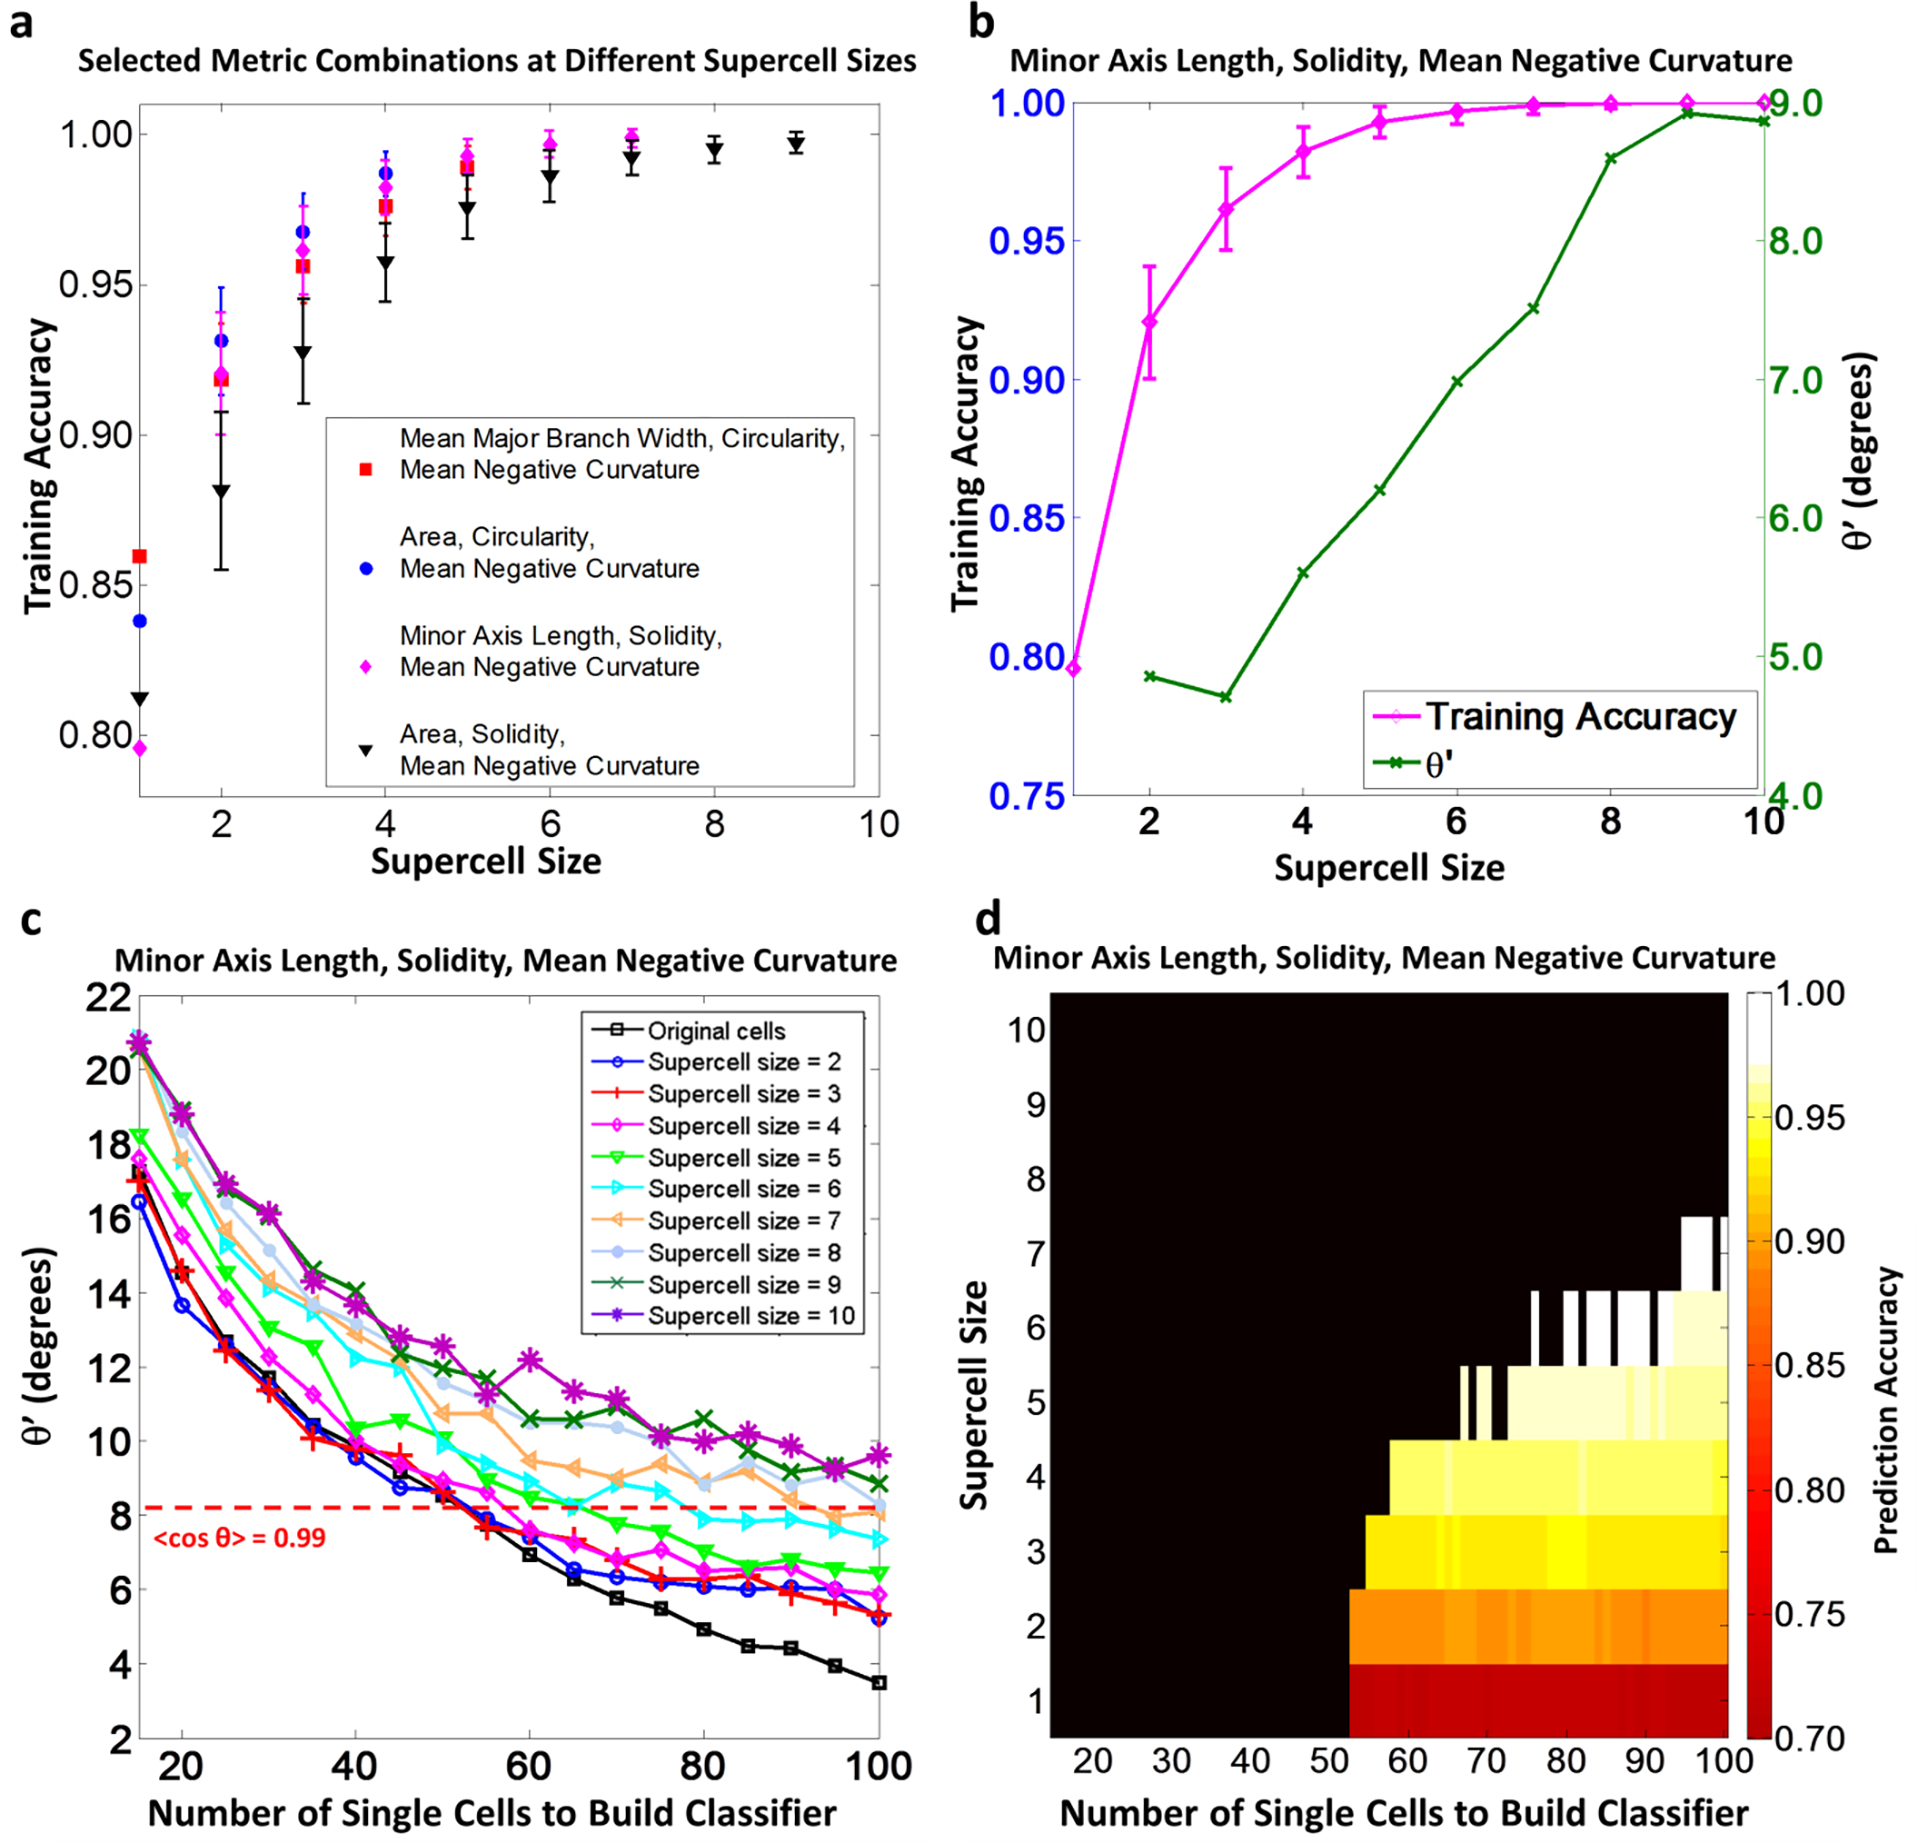
Fig 5.

(2-column). Results of SVM analysis and associated subsampling validation of selecting 3 shape metrics to compare morphological difference of hBMSCs populations of FS and SC. (a) At different supercell sizes, Shape metric combinations of 3 shape metrics with the highest training classification accuracy were selected if the average classifier hyperplane fluctuation ). The figure shows the training accuracies of SVMs built with these selected combinations for all supercell size, if ). (b) Training classification accuracy and average classifier hyperplane fluctuation of the selected shape metric combination in SVM training with supercell implementation. (c) In subsampling validation, classifier hyperplanes were built with different random subsample sizes and supercells sizes. Average classifier hyperplane fluctuation was quantified by . A threshold of ) was chosen to define stable classifier hyperplanes (red dotted line) (d) Prediction accuracy of the classifier hyperplanes in the subsampling validation when the built classifiers were tested with the rest of the total sample at different supercell sizes. The dark region represented combinations of training data size and supercell size causing unstable classifier hyperplane. In the stable region, combinations of the training data size and supercell size were colored according to the prediction accuracy. All error bars in (a) and (b) represent standard deviation.
