Abstract
Two different models have been proposed to explain how the endpoints of chromatin looped domains (‘TADs’) in eukaryotic chromosomes are determined. In the first, a cohesin complex extrudes a loop until it encounters a boundary element roadblock, generating a stem-loop. In this model, boundaries are functionally autonomous: they have an intrinsic ability to halt the movement of incoming cohesin complexes that is independent of the properties of neighboring boundaries. In the second, loops are generated by boundary:boundary pairing. In this model, boundaries are functionally non-autonomous, and their ability to form a loop depends upon how well they match with their neighbors. Moreover, unlike the loop-extrusion model, pairing interactions can generate both stem-loops and circle-loops. We have used a combination of MicroC to analyze how TADs are organized, and experimental manipulations of the even skipped TAD boundary, homie, to test the predictions of the ‘loop-extrusion’ and the ‘boundary-pairing’ models. Our findings are incompatible with the loop-extrusion model, and instead suggest that the endpoints of TADs in flies are determined by a mechanism in which boundary elements physically pair with their partners, either head-to-head or head-to-tail, with varying degrees of specificity. Although our experiments do not address how partners find each other, the mechanism is unlikely to require loop extrusion.
Research organism: D. melanogaster
Introduction
The chromosomes of multicellular animals have a regular and inheritable physical organization. This was first recognized in studies on the lampbrush chromosomes in amphibian oocytes and the polytene chromosomes of insects (Callan, 1963; Nora et al., 2020; Zhimulev and Belyaeva, 1991; Zhimulev et al., 1983). Subsequent research has shown that the architectural features inferred from analysis of lampbrush and polytene chromosomes are present in chromosomes throughout much of the animal kingdom. The key organizational principle is the subdivision of the chromatin fiber into a series of independent looped domains, commonly called ‘TADs’ (Cavalheiro et al., 2021; Chetverina et al., 2017; Jerković et al., 2020; Matthews and White, 2019; Rowley and Corces, 2018). With important exceptions, the arrangement of TADs along a given chromosome tend to be invariant and are largely independent of the cell type or developmental stage. This regular and inheritable organization is a reflection of the underlying mechanism of TAD formation. TADs are separated from each other by special elements called boundaries or insulators. While these elements have been found in many different species, they have been most fully characterized in Drosophila (Cavalheiro et al., 2021; Chetverina et al., 2017). Fly boundaries span DNA sequences of 150 bp to 1.5 kb in length and contain one or more nucleosome-free nuclease-hypersensitive regions. These nuclease-hypersensitive regions are targets for a large collection of DNA binding proteins that have been implicated in boundary function. Some of the fly boundary factors are widely conserved (CTCF, BEN family proteins, GAF), while others appear to be restricted to insect linages (Su(Hw), Pita, Zw5, Zipic, Mod(mdg4), BEAF; Heger et al., 2013; Heger and Wiehe, 2014; Schoborg and Labrador, 2010).
Boundary elements in flies are not only responsible for organizing the chromatin fiber, they also have genetic activities. When interposed between enhancers or silencers and target promoters, boundary elements block regulatory interactions (Bell et al., 2001; Chetverina et al., 2014; Chetverina et al., 2017). This insulating activity provides a mechanism for delimiting units of independent gene activity: genes located between a pair of compatible boundaries are subject to regulatory interactions with enhancers/silencers present in the same chromosomal interval, while they are insulated from the effects of enhancers/silencers located beyond either boundary in adjacent neighborhoods. Genetic studies suggest that the insulating activity of boundary elements is a consequence of subdividing the chromosome into a series of topologically independent domains (Cai and Shen, 2001; Gohl et al., 2011; Muravyova et al., 2001). Organizing the chromatin fiber into looped domains enhances contacts between sequences within the loop, while it suppresses contacts with sequences outside of the loop. While it is not known whether a similar insulation mechanism is at play in mammals, the fact that mammalian chromosomes are also subdivided into TADs by boundary-like elements suggests that it might be.
A critical question in chromosome biology is the mechanism(s) responsible for determining the endpoints of the loop domains, the TADs. In mammals, a novel loop-extrusion model has been proposed to not only generate chromosomal loops but also determine the endpoints of those loops (Alipour and Marko, 2012; Fudenberg et al., 2016; Guo et al., 2012; Guo et al., 2015; Nuebler et al., 2018; Sanborn et al., 2015). In this model, a cohesin complex initiates loop formation at a loading site within the ‘loop-to-be’ and then extrudes a chromatin loop until it bumps into CTCF-dependent roadblocks, one on each side of the extruding loop. The location of these roadblocks combined with the processive action of the cohesin complex determines the endpoints of each TAD (Davidson and Peters, 2021; Ghosh and Meyer, 2021; Mirny and Dekker, 2022; Perea-Resa et al., 2021). A key assumption of the loop-extrusion model is that mammalian boundaries are fully autonomous: they are roadblocks, and their physical presence in and of itself is sufficient to define the loop endpoint, independent of the functional properties of neighboring boundaries. In a more specific variant of this model, the relative orientation of the paired CTCF roadblocks is also important—in order to halt cohesin-mediated extrusion, the CTCF sites on each side of the loop must have a convergent orientation. In this model, the CTCF roadblocks are able to block an oncoming cohesin complex in only one direction; however, their intrinsic blocking activity is independent of the orientation of other CTCF sites in their neighborhood.
While this loop-extrusion mechanism is widely thought to be operative in mammals, the evidence regarding TAD formation and function in flies is seemingly inconsistent with this mechanism. Genetics studies have shown that fly boundaries are functionally non-autonomous and that their activities in both loop formation and gene regulation depend upon their ability to engage in direct physical interactions with other boundaries (Chetverina et al., 2014; Chetverina et al., 2017). That fly boundaries might function by physical pairing was first suggested by studies which showed that the gypsy transposon su(Hw) boundary and the bithorax complex (BX-C) Mcp boundary can mediate regulatory interactions (enhancer/silencer: reporter) between transgenes inserted at sites separated by 15–32 Mb or more (Muller et al., 1999; Sigrist and Pirrotta, 1997; Vazquez et al., 1993). Consistent with direct physical interactions, these distant transgenes co-localize in vivo, and in living tissue remain in contact for extended periods of time (Chen et al., 2018; Li et al., 2011; Vazquez et al., 2006).
Some of the parameters that govern pairing interactions have been defined in two different transgene assays, insulator bypass and boundary competition. In one version of the bypass assay, a set of enhancers are placed upstream of two different reporters (Cai and Shen, 2001; Kyrchanova et al., 2008a; Muravyova et al., 2001). When a single boundary is introduced between the enhancers and the closest reporter, the enhancers are unable to activate either reporter. However, if the same boundary is placed downstream of the closest reporter, bypass is observed. In this case the closest reporter, which is bracketed by the two boundaries, is still insulated from the enhancers; however, the downstream reporter is activated (Muravyova et al., 2001). Kyrchanova et al., 2008a showed that bypass activity is, in most cases, orientation-dependent. When the same boundary is placed in the upstream and downstream position, they typically need to be introduced in the opposite orientation. The reason for this is that self-pairing is head-to-head, and this configuration generates a stem-loop topology, bringing the upstream enhancers into close proximity to the downstream reporter. When the two boundaries are introduced in the same orientation, the enhancers do not activate the downstream reporter because a circle-loop rather than a stem-loop is formed (Chetverina et al., 2017; Kyrchanova et al., 2008a). Head-to-head pairing seems to be a common feature of self-pairing interactions between fly boundaries and was observed for scs, scs’, iA2 and wari (Kyrchanova et al., 2008a). A preference for head-to-head interactions is also observed for heterologous pairing interactions between different boundaries in the Abdominal-B (Abd-B) region of the BX-C (Kyrchanova et al., 2011; Kyrchanova et al., 2008b). There are some exceptions. The BX-C Fab-7 boundary pairs with itself and with its neighbor Fab-8 in both orientations (Kyrchanova et al., 2011; Kyrchanova et al., 2008b). Bypass activity also seems to depend upon finding the proper match. For example, when multimerized dCTCF or Zw5 binding sites are placed both upstream and downstream of the closest reporter, bypass is observed. However, there is no bypass when multimerized dCTCF sites are tested with multimerized Zw5 sites (Kyrchanova et al., 2008a). Similar results have been reported for the Zipic and Pita factors (Zolotarev et al., 2016). Boundary:boundary pairing preferences are also observed in competition assays in which different boundaries are introduced into the same transgene (Gohl et al., 2011). In these assays, the insulating activity of a boundary in the blocking position (between an enhancer and a reporter that is flanked by a 3’ boundary) is challenged by placing a heterologous boundary upstream of the enhancer. If the boundary upstream of the enhancer is a better match for the boundary located downstream of the reporter, then the insulating activity of the boundary in the blocking position can be compromised or lost altogether. These and other experiments argue that fly boundaries are functionally non-autonomous—that is, their activities depend upon their ability to physically interact with other boundaries.
However, the differences between the two models are not limited to the mechanisms for determining the endpoints of TADs. The models also differ in the possible topologies of the chromatin loops that form TADs. Only two loop topologies can be generated by the cohesin-extrusion mechanism. One is a stem-loop while the other is an unanchored loop. Depending upon the location of the roadblocks that halt cohesin extrusion and the cohesin loading sites, the chromatin fiber would be organized into a series of stem-loops. These stem-loops will be separated from each other by unanchored loops (see Figure 1B). This is the configuration that is often illustrated in articles discussing the loop-extrusion model. If the relevant roadblocks are very closely juxtaposed, then the unanchored connecting loops will disappear and be replaced by a series of stem-loops that point in opposite orientations, as illustrated in Figure 1C. Stem-loops are also possible in the boundary-pairing model, and they will be formed when two heterologous boundaries pair with each other head-to-tail in cis (see Figure 1D). Like loop-extrusion, the stem-loops could be separated from each other by unanchored loops (Figure 1E). If the boundaries in the neighborhood pair with each other head-to-tail, a series of connected stem-loops pointing in opposite orientations will be generated. In this case, the main axis of the chromosome would be a series of paired boundaries (Figure 1F).
Figure 1. Diagrams of possible loop topologies generated by loop extrusion and boundary:boundary pairing.

(A) Cohesin embraces a loop at a loading site somewhere within the TAD-to-be, and then extrudes a loop at an equal rate on both strands. Extrusion continues until cohesin encounters boundary roadblocks on both strands. (B) In one model, the orientation of the roadblock is important. As a consequence, the chromatin fiber will be organized into a series of stem-loops separated from each other by unanchored loops. (C) If the presence of a boundary roadblock, but not its orientation, is sufficient to halt extrusion, the chromatin fiber will be organized into a series of linked stem-loops. The main axis of the chromosome will be defined by the cohesin:CTCF roadblocks. (D) The pairing of two boundaries head-to-tail generates a stem-loop. (E) If boundary pairing interactions are strictly pairwise, head-to-tail pairing will generate a series of stem-loops separated from each other by unanchored loops. (F) If boundaries can engage in multiple head-to-tail pairing interactions, the chromosome will be organized into a series of linked stem-loops. The main axis of the chromosome will be defined by a series of paired boundaries. (G) The pairing of two boundaries head-to-head generates a circle-loop. (H) If boundary pairing interactions are strictly pairwise, there will be a series of circle-loops separated from each other by unanchored loops. (I) If boundaries can engage in multiple head-to-head pairing interactions, the chromatin fiber will be organized into a series of circle-loops connected to each other at their base. Pairing interactions between boundaries #1 and #2 need not be in register with the pairing of boundaries #2 and #3. In this case, the main axis of the chromosome may bend and twist, and this could impact the relative orientations of the circle-loops.
Stem-loops are not, however, the only loop topology that can be generated in the boundary-pairing model. If the neighboring boundaries pair with each other head-to-head instead of head-to-tail, a circle-loop structure will be generated (Figure 1G). Like stem-loops, the circle-loops could be connected by unanchored loops (Figure 1H). Alternatively, if boundaries pair with both neighbors head-to-head, this will generate a series of linked circle-loops oriented in (more or less) the same direction (see Figure 1I).
In the studies reported here, we have critically evaluated these two models. We have used a combination of MicroC to analyze how TADs are organized and experimental manipulations to test the predictions of the ‘loop-extrusion’ and the ‘boundary-pairing’ models. For these experimental manipulations, we have used the well-characterized homie boundary from the even skipped (eve) locus. homie together with nhomie flank the 16 kb eve locus, and these two elements share many of the properties of other fly boundaries (Fujioka et al., 2013; Fujioka et al., 2009). Like the gypsy and Mcp boundaries, nhomie and homie can mediate long-distance regulatory interactions. For example, a lacZ reporter transgene containing homie (or nhomie) inserted on one homolog can be activated by an eve enhancer in a homie- (or nhomie-) containing transgene inserted on the other homolog, over a distance of 2 Mb (Fujioka et al., 2016). Long-distance activation is also observed in heterologous combinations of nhomie and homie, but not in combinations with phage lambda DNA. Similarly, regulatory interactions are observed when a homie- or nhomie-containing reporter is inserted at an attP landing site in the hebe gene, 142 kb upstream of the eve locus (Chen et al., 2018; Fujioka et al., 2016; Fujioka et al., 2009). In this case, the eve enhancers drive reporter expression during development in a pattern that mimics the stage- and tissue-specific expression of the endogenous eve gene. Activation also depends upon the orientation of the boundary (5’→3’) relative to the reporter in the transgene. For homie, the reporter must be located ‘upstream’ of the boundary (5’→3’), just like the eve enhancers (and eve gene) are ‘upstream’ of endogenous homie (see Figure 2B). Little or no activation is observed when the relative orientation is reversed, so that the reporter is located ‘downstream’ of homie. For nhomie, the reporter must be located ‘downstream’, in the same relative position as that in which the eve enhancers and eve gene are located with respect to endogenous nhomie (5’→3’: Figure 2B).
Figure 2. TAD organization of the even-skipped locus and neighboring sequences.
(A) The eve TAD is a volcano with a plume that is anchored by nhomie and homie. ChIP-seq data below the MicroC map indicate that many of the known fly chromosomal architectural proteins are associated with the two eve boundary elements in vivo (Cuartero et al., 2014; Duan et al., 2021; Gaskill et al., 2021; Li et al., 2015; Sun et al., 2015; Ueberschär et al., 2019; Zolotarev et al., 2016). (B) The eve locus forms a stem-loop structure. In this illustration, nhomie pairs with homie head-to-tail, and this forms a stem-loop that brings sequences upstream of nhomie and downstream of homie into contact, as is observed in insulator bypass assays (Kyrchanova et al., 2008a). The eve locus is shown assembled into a coiled ‘30 nM’ chromatin fiber. (C) MicroC contact pattern for the chromosomal region spanning the attP site at –142 kb and the eve locus. Like the eve volcano, this contact pattern was generated using aggregated previously published NC14 data (Batut et al., 2022; Levo et al., 2022). A black arrow indicates the –142 kb locus where transgenes are integrated into the genome. A blue arrow indicates the position of the Etf-QO gene. Note the numerous TADs between the –142 kb hebe locus from the eve ‘volcano TAD’. Individual TADs are labeled TA—TM. Black boxes indicate positions of sequences that, based on ChIP experiments, are bound by one or more known insulator proteins in vivo.

Figure 2—figure supplement 1. TAD organization of the even-skipped gene and upstream region.

Figure 2—figure supplement 2. Trouble ahead, trouble behind.

Figure 2—figure supplement 3. Models for the formation of LDC domains.

Results
The eve TAD
We used MicroC to probe the TAD organization of the eve locus and the genomic region that extends from eve to just beyond the attP site at –142 kb. For this purpose, we chose nuclear cycle (NC) 14 embryos. DNA replication commences soon after nuclei exit the previous mitosis, and continues for nearly an hour until the nuclei arrest in G2, and the process of cellularization is completed. As sister chromosomes in flies pair with each other in register, there will be two juxtaposed copies of this region of the chromosome in most nuclei. The sister chromosomes should be linked to each other by cohesin in preparation for the asynchronous cellular divisions at the end of NC14 (Collier and Nasmyth, 2022; Gligoris et al., 2014). While homolog pairing is limited in pre-cellular blastoderm embryos, there are regions of the chromosome that already show evidence of pairing (Erceg et al., 2019; Fung et al., 1998). In fact, transvection mediated by transgenes containing the gypsy insulator and the homie and Fab-8 boundaries has been observed in live imaging studies of nuclear cycle 14 embryos (Lim et al., 2018). Since the NC14 nuclei are just emerging from an earlier mitosis and are undergoing DNA synthesis, one would imagine that other key features of chromosome organization might also be in the process of being established. Thus, it should be possible to capture evidence of intermediates like those expected to be generated by extruding cohesin complexes as they move through the eve TAD and other nearby loci at this stage of development.
Shown in Figure 2A is a blow-up of the TAD organization of the eve locus. As expected, the left and right boundaries of the eve TAD correspond to nhomie and homie, respectively, and sequences containing these two boundaries converge at the apex of the eve interaction triangle. All the sequences within the TAD appear to come into contact with each other and define a high density of internal contact domain (HDIC). These contacts are expected to be generated, at least in part, by the sliding of the chromatin fiber within the TAD against itself, much like sequences in circular/supercoiled DNA can interact with each other (Figure 1E). There are also sequences within the eve TAD that show enhanced interactions. For example, there is a darker interaction triangle connecting nhomie and the promoter region, while another triangle connects homie and the PRE adjacent to homie to the promoter region. These enhanced internal contacts would be expected to help insulate the eve gene from external regulatory elements, and at the same time facilitate interactions between eve and its upstream and downstream enhancers.
As predicted by both the loop-extrusion and boundary-pairing models, the eve TAD is a stem-loop, not a circle-loop (Figure 2B). This is evident from the prominent ‘volcano plume’ at the apex of the eve TAD (volcano triangle). A volcano plume is observed because sequences flanking eve are brought into close proximity when homie and nhomie are linked to each other by either cohesin or by head-to-tail pairing (see Figure 1: see also Ke et al., 2024). Figure 2—figure supplement 1 shows the hierarchy of interactions between TADs to either side of eve (L-M, K-M, and J-M in Figure 2—figure supplement 1). This conclusion is supported by previous transgene studies. As first described in the boundary bypass experiments of Cai and Shen, 2001 and Muravyova et al., 2001, the formation of a stem-loop structure when two boundaries are linked together brings sequences immediately beyond the linked boundaries into close proximity with each other. In this assay, a stem-loop structure is required, as it enables enhancers flanking the ‘upstream’ boundary to interact with reporters flanking the ‘downstream’ boundary (Kyrchanova et al., 2008a). In contrast, a circle-loop configuration does not bring the neighbors to either side of eve into close proximity.
While a stem-loop is the topology expected for the eve TAD in both models, one feature of the TAD is inconsistent with the loop-extrusion model. According to this model, loops (TADs) are generated by a cohesin complex that forms a small bubble at a loading site somewhere in the TAD-to-be and then extrudes both strands of the growing loop at an equal rate until it bumps into the boundary roadblocks (Davidson and Peters, 2021; Ghosh and Meyer, 2021; Mirny and Dekker, 2022; Perea-Resa et al., 2021). If the loading site were located in the middle of the TAD-to-be, and the extrusion intermediates in a population of nuclei were captured by crosslinking, one should observe a crosslink-generated stripe that begins at the loading site and extends perpendicular to the chromosomal DNA until it reaches the apex that links the two TAD boundaries with imaginary lines of 45° (Figure 2—figure supplement 2B). This is the pattern that would be generated by a ‘broken zipper’ when it transiently links the zipper teeth equidistant from the initial ‘loading site’ (Figure 2—figure supplement 2A). If the loading site is off center to the left, the crosslinking of the passing cohesin complex in a population of nuclei will generate a perpendicular stripe until cohesin come to a halt when it encounters the roadblock on the left (Figure 2—figure supplement 2C). Assuming that the complex continues to extrude the right strand, it will then generate a stripe at a 45° angle that extends to the apex of the TAD. If the loading site corresponds to one of the CTCF roadblocks or is located close to the roadblock, the cohesin complex will generate a 45° stripe that comes to a halt at the apex of the triangle when it encounters the neighboring CTCF roadblock (Figure 2—figure supplement 2D and E). If there are multiple loading sites within the TAD, there should be a series of perpendicular stripes that generate and sequentially reinforce the stripe(s) at 45° (Figure 2—figure supplement 2F). However, in spite of the fact that NC14 fly embryos should provide by far the best prospect of actually capturing loop extrusion intermediates, there are no vertical stripes in the eve TAD, nor are there stripes at 45° that extend to the apex of the eve TAD. Nor do we observe a population of perpendicular stripes that convert into a series of reinforced 45° stripes. There is also no evidence of stripes that are initially tilted to the left or right of a ‘loading site’, as might be observed if the rate of extrusion were unequal on the two strands, and then subsequently convert to a 45° stripe as cohesin comes to a halt at the first boundary encountered.
TADs in the eve environs
The attP insertion site at –142 kb is near the end of the first exon of the hebe transcription unit (Figure 2C). It is located just within a ~14 kb TAD, TB, that has a high density of internal contacts, and extends from the hebe promoter to the 3’ end of the neighboring dila gene. In between hebe and the eve locus, there are at least 10 distinct TADs, TC-TL (Figure 2C). The endpoints of most of these TADs correspond to sequences that are associated with one or more known chromosomal architectural factors (dots along the horizontal axis in Figure 2C).
These TADs correspond to the fundamental building blocks for organizing the 3D architecture of this chromosomal segment. Superimposed upon these TADs are regions that exhibit lower density of contacts (LDC). For example, the mef2 gene spans two TADs, TJ and TK. TK contains the mef2 distal promoter region and extends to the internal mef2 promoter, while TJ extends to near the promoter of the divergently transcribed Etf-QO gene (blue arrow). Both of these TADs are linked together by a rectangular LDC domain, J-K (see Figure 2—figure supplement 1). Likewise, TJ is linked to its immediate neighbor TI by the LDC domain I-J. In the next level, TADs separated by a single TAD are linked together. In the region immediately above TJ, the LDC domain I-K links TI to TK (Figure 2—figure supplement 1). Similarly, TJ is linked to TL by J-L, while TJ is also linked to the large TAD TM (which contains TER94 and the neighboring gene, pka-R2) on the other side of eve by J-M. The same pattern of a hierarchical series of LDC domains linking TAD neighbors, TAD next-door neighbors and next-next-door neighbors is observed in the DNA segment that includes the hebe gene.
Cohesin-mediated loop extrusion
Like eve, the TADs in the region between eve and the attP site in the hebe locus are defined by right-angle triangles (volcanos) with a high density of internal contacts. However, unlike eve, these volcano triangles do not have a plume, and instead are surrounded by a series of LDC rectangular ‘clouds’. This is not the contact pattern that one might expect for either a series of stem-loops connected by unanchored loops or a series of stem-loops connected to each other. Moreover, there are no perpendicular or angled crosslinking stripes (broken zippers) emanating from the base of these triangles, nor are their stripes along their 45° legs. Thus, in spite of the fact that the NC14 nuclei used in this analysis are just emerging from an earlier mitosis and a round of DNA synthesis, and should be in the process of assembling TADs, the crosslinking signatures that should be generated by the embrace of passing cohesin complexes are completely absent.
In the loop-extrusion model, the LDC domains would arise in a subset of nuclei because the extruding cohesin complex breaks through one or more boundary roadblocks before its progression is halted (Figure 2—figure supplement 3A versus B, C, and D; Hsieh et al., 2020; Krietenstein et al., 2020). Breakthroughs could occur at only one roadblock on one side of the extruding loop (Figure 2—figure supplement 3B, C), or at multiple roadblocks on one or both sides (Figure 2—figure supplement 3D), giving rise to a set of overlying LDC domains like that evident in the region between hebe and eve. However, while there would have to be multiple breakthrough events to account for the hierarchical array of LDC domains observed in these NC14 embryos, there is no evidence of the 45o crosslinking stripes that would be expected to mark the legs of the LDC domains following the breakthrough. For example, the I-J LDC domain (Figure 2—figure supplement 1) could be generated by cohesin complexes that initiated extrusion in either TI or TJ and then failed to halt at the TI:TJ boundary (green arrowhead). In either case, there should be a 45o stripe of crosslinking that marks (at least part of) the left (TI) and/or the right (TJ) leg of the I-J LDC domain and extends to the apex of the TI-TJ LDC triangle; however, there is no evidence of such stripes. Nor is there evidence of crosslinking stripes marking one or both legs of the J-K or I-K LDC domains (Figure 2—figure supplement 1).
While the LDC domains associated with the TADs located between eve and the hebe locus could potentially be explained by cohesin breaking through one or more boundaries (even though we do not observe the expected stripe intermediates), it is important to note that the eve boundaries, nhomie and homie, do not appear to be subject to as frequent break-through events. This is because, unlike the other TADs in the neighborhood, the LDC domains that link eve to TA and TL are much more lightly populated compared to the LDC domain that links TA to TL.
Boundary:boundary pairing
At least two different mechanisms are expected to account for the TADs and LDC domains in the region between eve and the attP insertion site at –142 kb. First, since none of the TADs in this DNA segment (with the possible exception of TA) are topped by volcano plumes, they could correspond to circle-loops. As circle-loops are generated by head-to-head pairing, the boundaries in the region between nhomie and hebe would be expected to pair with each other head-to-head. (The TAD-to-TAD contact maps generated by circle-loops and stem-loops are considered further in the accompanying paper, Ke et al., 2024).
As illustrated in Figure 2—figure supplement 3E–G, the coiled circle-loop TADs, though topologically independent, are expected to be in relatively close proximity to each other. This means that in addition to crosslinking events within the TADs, there will be crosslinking events between neighboring TADs. These crosslinking events could generate the LDCs seen in Figure 2C and Figure 2—figure supplement 1. Since TADs next to each other (Figure 2—figure supplement 3E, F; Figure 2—figure supplement 1I–J or J–K) would typically be expected to interact more frequently than TADs separated by one, two, or more TADs (Figure 2—figure supplement 3G; Figure 2—figure supplement 1I–K or J–L), there should be a progressive reduction in contact frequency at each step. This is generally what is seen (see Figure 2—figure supplement 1). While connected stem-loops generated by loop extrusion should also bump into one another, contacts between next-door neighbors might be expected to be less frequent than contacts between next-next-door neighbors (Figure 1B and C and Figure 2—figure supplement 3A). (TAD-to-TAD crosslinking and the impact of loop topology is further examined in Ke et al., 2024).
The second mechanism for generating LDC domains would be switching and/or combining pairing partners (Figure 2—figure supplement 3H–J). Though imaging studies suggest that pairing interactions can be of relatively long duration (>30 min: Chen et al., 2018; Vazquez et al., 2006), they are not permanent, and other nearby boundaries can compete for pairing interactions (Gohl et al., 2011). If switching/combining occurs in NC14 embryos (see Figure 2—figure supplement 3H–J), then the precise pattern of TADs and LDC domains could also be impacted by the relative avidity of potential pairing partners in the neighborhood, and also the distances separating potential partners. For example, the rectangle linking TH and TI (H-I in Figure 2—figure supplement 1) could represent partner switching, so that the boundary between TI and TJ (green arrowhead in Figure 2—figure supplement 1) sometimes pairs with the boundary separating TH and TI (blue arrowhead in Figure 2—figure supplement 1) and sometimes with the boundary separating TG and TH (red arrowhead in Figure 2—figure supplement 1). Distant boundary elements could also occasionally interact with each other, generating a supra-TAD that contains multiple TAD domains. For example, at the apex of the LDC domain B-I, there is an interaction dot (small purple arrow, Figure 2—figure supplement 1) that links the TA-TB boundary to the TI-TJ boundary (green arrowhead).
Activation of a distant reporter by the eve enhancers
In previous studies, we found that a minimal 367 bp homie fragment can orchestrate regulatory interactions between the eve enhancers and reporters inserted at an attP site in the first intron of the hebe transcription unit, 142 kb upstream of the eve gene (Fujioka et al., 2016). This minimal fragment lacks the one potential homie CTCF site, but has sites for several other generic boundary proteins, including BEAF, Zipic, Su(Hw), Pita, and Ibf2. In blastoderm stage embryos, lacZ reporter expression was observed in a 7-stripe pattern that coincided with the stripes of the endogenous gene. However, at that stage only a subset of eve-expressing nuclei also expressed the reporter. Later in development, during mid-embryogenesis, reporter expression was observed in cells in the dorsal mesoderm, the ventral CNS, and in the anal plate region, in a pattern that recapitulated eve gene expression (Fujioka et al., 2016). At these later stages, most of the eve-expressing cells also appear to express the reporter. The eve-dependent activation of the reporter in a stripe pattern has also been visualized in live imaging of pre-cellular blastoderm-stage embryos (Chen et al., 2018). Within the 7 eve stripes, the majority of the nuclei (~80–85%) did not express the lacZ reporter. In these nuclei, the transgene was found to be at a considerable average physical distance from the eve locus (~700 nM). In the remaining nuclei, the transgene was located in closer proximity to the eve locus (~330 nM, on average). Within this subset, the transgene was expressed in most of the nuclei. Moreover, in most cases in which the transgene was active, it remained in close proximity and continued to express lacZ for the duration of the experiment (~30 min).
In the two models for TAD formation, quite different mechanisms must be invoked to account for activation of the reporter at –142 kb by the eve enhancers. In the boundary-pairing model, the transgene homie boundary at –142 kb loops over the intervening TADs and pairs with the nhomie:homie complex flanking the eve TAD (c.f., Figure 3B and C). In the loop-extrusion model, a cohesin complex initiating loop extrusion in the eve TAD must break through the nhomie roadblock at the upstream end of the eve TAD. It must then make its way past the boundaries that separate eve from the attP site in the hebe gene, and come to a halt at the homie boundary associated with the lacZ reporter. This would generate a novel TAD, eveMammoth (eveMa), that extends from the eve homie all the way to the homie fragment at –142 kb, and encompasses both the reporter and the eve gene, including its enhancers (c.f., Figure 3D). Of course, the eveMa TAD could also be generated by a cohesin complex that initiated in, for example, TF. However, in this case, the runaway cohesin complex would have to break through the intervening boundary roadblocks in both directions. In both the boundary-pairing and loop-extrusion models, the configuration of the chromatin fiber would lead to the activation of lacZ expression by the eve enhancers, while the reporter would be protected from the hebe enhancers by the homie boundary.
Figure 3. Schematics of boundary pairing and loop extrusion.
(A) GeimohL and GhomieL transgenes and the eve locus on a linear map. The same color codes are used throughout. In the eve locus, nhomie (blue arrow) and homie (red arrow) are oriented, by convention, so that they are pointing toward the right. This convention is maintained in the two transgenes. In GeimohL, homie (top) is in the opposite orientation from homie in the eve TAD and so is pointing away from the eve TAD. In GhomieL (bottom), homie is in the same orientation as homie in the eve locus, and so is pointing toward the eve TAD. (B) Predicted boundary pairing interactions between GeimohL and the eve TAD. homie in the transgene pairs with homie in the eve TAD head-to-head. Since homie in the transgene is pointing in the opposite orientation from homie in the eve TAD, a stem-loop will be generated. (C) If homie in the transgene also pairs with nhomie in the eve TAD head-to-tail, a loop structure like that shown in C will be generated. In this topology, eve-lacZ is in close proximity to the eve enhancers, and eve-gfp is in contact with the hebe enhancer. (D) Loop-extrusion model for GeimohL. Transgene homie and endogenous homie determine the endpoints of the extruded eveMammoth (eveMa) loop. As in B, the topology of eveMa is a stem-loop. This topology brings eve-lacZ into close proximity to the eve enhancers, while eve-gfp is in another loop that contains the hebe enhancers. (E) Predicted boundary pairing between GhomieL and the eve locus. The GhomieL transgene is inserted in the same chromosomal orientation as GeimohL; however, the homie boundary is inverted so that it is in the same orientation as the eve homie, and so it is pointing toward the eve TAD. homie in the transgene will pair with homie in the eve locus head-to-head, and this generates a circle-loop. (F) If homie in the transgene also pairs with nhomie in the eve TAD, a loop structure like that shown in F will be generated. In this topology, eve-gfp will be activated by both the eve and hebe enhancers. (G) Loop-extrusion model for GhomieL. The cohesin complex bypasses transgenic homie and is stopped at an upstream boundary X, to generate a novel eveGarantuan (eveGa) loop. Both eve-gfp and eve-lacZ are located within the same eveGa TAD, and thus should interact with eve. Since the hebe enhancers are within this TAD as well, they would also be able to activate both reporters.

Figure 3—figure supplement 1. Loop extrusion: eveElephant.

To test these two models, we used a transgene that has two divergently transcribed reporters, lacZ and gfp, that are each under the control of an eve promoter (Figure 3A). Two different versions of the transgene were generated. In the first, the eve-lacZ reporter is located “upstream” of homie (with respect to the 5’→3’orientation of homie in the eve locus), while eve-gfp is located downstream. In the second, the orientation of homie within the transgene is reversed, so that eve-gfp is upstream of homie, while eve-lacZ is downstream. These two transgenes were then individually inserted into the attP site at –142 kb. For the pair shown in Figure 3A, GeimohL and GhomieL, the transgenes were inserted so that eve-lacZ is on the eve side of the homie boundary. The eve-gfp reporter is on the opposite side of the homie boundary and is farther away from the eve locus. This places the eve-gfp reporter next to a series of hebe enhancers located farther upstream (Figure 2C), in the intron of the hebe gene, and thus it should be subject to regulation by these enhancers. In the other pair, LhomieG and LeimohG, the entire transgene is inserted in the opposite orientation in the chromosome so that eve-gfp is on the eve side of homie, while eve-lacZ is next to the hebe enhancers (illustrated in Figure 6A). As a control, we also generated a transgene in which lambda DNA instead of homie was inserted between the eve-gfp and eve-lacZ reporters. This transgene was oriented so that eve-lacZ was on the eve side of the lambda DNA, and eve-gfp was close to the hebe enhancers.
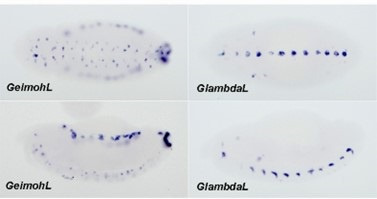
The eve enhancers drive lacZ reporter expression in the GeimohL insert
The results for transgenes GeimohL and the control GlambdaL are most straightforward and will be considered first. In both the loop-extrusion and boundary-pairing models, the GlambdaL control is not expected to display any regulatory interactions with the eve locus. Figure 4C shows that this is the case: the eve-lacZ and eve-gfp reporters in GlambdaL embryos are silent at the blastoderm stage, and transcripts are only very rarely detected. Later in development, both reporters are expressed in a repeating pattern along the dorsal midline (Figure 4E). This expression is driven by the hebe gene enhancers located just beyond the gfp-reporter (Fujioka et al., 2009).
Figure 4. The lacZ reporter is activated by eve enhancers in the GeimohL insert.

(A) Expression patterns of endogenous eve in early (stage 4–5) and late (stage 14–16) embryos by smFISH. eve (Atto 633) probes were used to hybridize with eve mRNA. eve is shown in yellow and DAPI in blue. N>3. (B) Schematics of transgenes. (C) Expression patterns of transgenic reporters in early-stage embryos. Top: GlambdaL; bottom: GeimohL. GFP is in green, lacZ is in orange, and DAPI is in blue, here and in E. (D) Quantification of normalized stripe signals for transgenes shown in C. The reporter smFISH intensity (signal to background), here and in F, was measured, normalized, and plotted as described in Methods. N>3. n=27 for GlambdaL and n=42 for GeimohL. (E) Expression patterns of transgenic reporters in late-stage embryos. Top: GlambdaL; bottom: GeimohL. (F) Quantification of normalized stripe signals for transgenes shown in E. N>3. n=27 for GlambdaL, n=56 for GeimohL. Scale bars = 200 μm. N = # of independent biological replicates. n = # of embryos. The paired two-tailed t-test was used for statistical analysis. ****p<0.0001, ns: not significant. Raw measurements are available in Supplementary file 3.
In the case of the GeimohL insert, regulatory interactions between the transgene and the eve locus will be observed if a stem-loop is established that links the transgene to eve. In the loop-extrusion model, the breakthrough cohesin complexes would generate a stem-loop, eveMammoth (eveMa), by coming to a halt at the homie boundary in the transgene and the homie boundary in eve, as illustrated in Figure 3D. This will place the lacZ reporter in close proximity to the eve enhancers. It will also disrupt the eve TAD, as nhomie is no longer linked to the homie boundary by cohesin. In the boundary-pairing model, the lacZ reporter in the transgene is ‘upstream’ of homie just like the eve gene and its enhancers are ‘upstream’ of homie in the eve locus. Since homie pairs with itself head-to-head, pairing between homie in the transgene and homie in the eve locus will generate the same stem-loop as that generated by loop-extrusion (Figure 3B). However, because homie pairs with nhomie head-to-tail, a more complex multi-loop structure like that in Figure 3C would be expected if the pairing interactions with the transgene do not disrupt the eve TAD. Consistent with a tripartite structure of the sort shown here, previous studies have shown that three Mcp transgenes on three different chromosomes can interact with each other genetically (Muller et al., 1999). Subsequent direct visualization of Mcp-mediated pairing interactions in imaginal discs by Vazquez et al., 2006 showed that four Mcp-containing transgenes separated by Mbs (at Bridges cytogenetic intervals ~65 on the left arm of chromosome 3, and ~83 and~95 on the right arm of chromosome 3) and/or located on different homologs, clustered in the same nuclear foci in 94% of the nuclei.
As predicted from the formation of a stem-loop linking the transgene to the eve locus, lacZ is expressed in blastoderm-stage embryos in 7 stripes that coincide with the 7 stripes of the endogenous eve gene. However, unlike eve, not all nuclei in the seven stripes express lacZ (compare with the eve control in Figure 4A). Later, during mid-embryogenesis, lacZ is expressed in the mesoderm, the CNS, and the anal plate in a pattern that mimics the endogenous eve gene. At this stage, almost all eve-positive cells are also positive for lacZ. Unlike the GlambdaL transgene, the hebe enhancers do not drive eve-lacZ expression, as they are beyond the homie boundary (Figure 4E). The eve-gfp reporter in the GeimohL transgene responds differently. As was observed for the GlambdaL control, the eve enhancers drive little, if any, gfp expression, either at the blastoderm stage or later in development (Figure 4C and E). Instead, gfp is expressed in the midline during mid-embryogenesis under the control of the hebe enhancers (Figure 4E), which should be in the same TAD as eve-gfp. These results would be consistent with both the loop-extrusion (eveMa) and boundary-pairing models (Figure 3B–D).
The eve enhancers drive GFP reporter expression in the GhomieL insert
The situation is more complicated for the GhomieL transgene. This transgene is inserted in the same chromosomal orientation as GeimohL: eve-lacZ is on the eve side of the homie boundary and eve-gfp is on the hebe enhancer side of the boundary. However, the orientation of the boundary within the transgene is switched so that eve-gfp rather than eve-lacZ is ‘upstream’ of homie. In the boundary-pairing model, flipping the orientation of homie in the transgene but keeping the same orientation of the transgene in the chromosome will have two consequences. First, as illustrated in Figure 3E, the topology of the chromatin loop connecting the homie boundary in the transgene and the homie boundary in the eve locus will change from a stem-loop to a circle-loop. The reason for the change in loop topology is that homie pairs with homie head-to-head (Fujioka et al., 2016). As before, the transgene homie will pair with eve homie head-to-head to generate a simple circle-loop (Figure 3E); however, if, as expected, it also pairs with nhomie so that the eve TAD remains intact, a more complicated loop structure would be generated (Figure 3F). Second, the reporter that is preferentially activated by the eve enhancers will switch from eve-lacZ to eve-gfp. In order to be activated by the eve enhancers, the reporter must be “upstream” of the transgene homie. This physical relationship means that the eve-gfp reporter will be activated by the eve enhancers independent of the orientation of the transgene in the chromosome. On the other hand, the eve-lacZ reporter will not be activated by the eve enhancers. In addition, it will still be insulated from the hebe enhancers by the homie boundary.
It is not possible to form a circle-loop in the loop-extrusion model. Instead, the breakthrough cohesin complex will come to a halt, as before, when it encounters the inverted homie boundary at –142 kb (Figure 3D). This means that the eve-lacZ reporter will be in the same TAD (eveMa) as the eve enhancers and will be activated by the eve enhancers. In contrast, the eve-gfp reporter will be in the neighboring TAD and will not be activated by the eve enhancers. It will, however, be regulated by the nearby hebe enhancers.
Figure 5 shows that the four predictions of the boundary-pairing model are correct: (a) the eve enhancers drive eve-gfp expression, (b) the hebe enhancers drive eve-gfp expression, (c) eve-lacZ is not subject to regulation by the eve enhancers, and (d) eve-lacZ is insulated from the hebe enhancers. This would also mean that pairing of the transgene homie in the GhomieL insert with homie in the eve locus generates a circle-loop (or a more complicated multi-loop structure if it also pairs with nhomie), not a stem-loop, as was the case for GeimohL. In contrast, since loop-extrusion cannot generate circle-loops, the key predictions of this model, namely that eve-gfp will be silent while eve-lacZ will be regulated by the eve enhancers, are not satisfied. Instead, eve-gfp is activated by the eve enhancers, while eve-lacZ is not.
Figure 5. The GFP reporter is activated by both eve and hebe enhancers in the GhomieL insert.

(A) Schematics of transgenes. (B) Expression patterns of transgenic reporters in early-stage embryos. Top: GlambdaL; bottom: GhomieL. GFP is in green, lacZ is in orange, and DAPI is in blue, here and in D. (C) Quantification of normalized stripe signals as represented in B. The reporter smFISH intensity (signal to background) was measured, normalized, and plotted as described in Methods, here and in E. N>3. n=27 for GlambdaL, n=46 for GeimohL. (D) Expression patterns of transgenic reporters in late-stage embryos. Top: GlambdaL; bottom: GhomieL. (E) Quantification of normalized stripe signals for transgenes shown in D. N>3. n=27 for GlambdaL, n=59 for GeimohL. Scale bars = 200 μm. N = # of independent biological replicates. n = # of embryos. The paired two-tailed t-test was used for statistical analysis. ****p<0.0001, ns: not significant. Raw measurements are available in Supplementary file 3.
While the results described above for the GhomieL transgene are inconsistent with a ‘simple’ loop-extrusion model, there is one potential caveat: the 5’→3’ orientation of the homie boundary is inverted so that it is ‘pointing’ towards the eve locus, rather than away from it like the endogenous homie boundary. In this orientation, it is possible that homie no longer functions as an effective roadblock, and instead the cohesin complex emanating from the eve locus (or from a loading site somewhere in between) slips past this homie fragment and continues until it is blocked by a properly oriented boundary further upstream. In this case, the newly formed stem-loop, eveGargantuan (eveGa; Figure 3G), would include the eve-gfp reporter, and it would then be activated by the eve enhancers. However, there are two problems with postulating this novel eveGa TAD. First, eve-lacZ would be in the same eveGa TAD as eve-gfp, and it should also be activated by the eve enhancers. Second, since the homie boundary was bypassed by the cohesin complex to form the larger eveGa TAD, it should not be able to block the hebe enhancers from activating eve-lacZ. Neither of these predictions is correct.
LeimohG and LhomieG: Orientation of homie in the transgenes determines which reporter is activated
To confirm these conclusions, we examined the expression patterns of the reporters when the transgene is inserted in the opposite orientation in the –142 kb attP site. In this transgene orientation, eve-gfp is on the eve side of the homie boundary while eve-lacZ is close to the hebe enhancers. In the boundary-pairing model, the orientation of homie in the transgene determines which reporter will be preferentially activated, while the orientation of the transgene homie in the chromosome determines the topology of the resulting loop(s). The transgene homie will pair with the endogenous homie head-to-head. Since the transgene homie in LeimohG is in the opposite orientation from the endogenous homie, this pairing interaction will generate a stem-loop, if pairing interactions are exclusively pairwise. A more complicated multi-loop structure will be formed if the transgene homie interacts simultaneously with both endogenous boundaries (Figure 6B). In both cases, eve-gfp will be activated by the eve enhancers. On the other hand, since this orientation places eve-lacZ on the same side of the transgene homie as the hebe enhancers, they will activate it, rather than the eve-gfp reporter (Figure 6B). In LhomieG, the topology of the loop (or multi-loop) will switch, and eve-lacZ will be activated by both the eve and hebe enhancers (Figure 6C).
Figure 6. Expression of reporters in the LeimohG and LhomieG inserts.
(A) Schematics of GE transgenes. (B) Boundary pairing for LeimohG transgene long-range interactions. In this topology, GFP is in close proximity to eve enhancers, and lacZ is in contact with the hebe enhancer region. (C) Boundary pairing for the LhomieG transgene. In this topology, lacZ is in close proximity to both the eve enhancers and the hebe enhancers. (D) Loop-extrusion model for LeimohG. Transgenic homie and endogenous homie flank the eveMammoth loop. In this topology, GFP is in close proximity to eve enhancers, and lacZ is close to the hebe enhancers. (E) Loop-extrusion model for the LhomieG transgene. The cohesin complex bypasses transgenic homie and is stopped at an upstream boundary X, to create the eveGarantuan loop. Both GFP and lacZ are at a similar physical distance from eve enhancers and hebe enhancers in this topology. (F) Expression patterns of transgenic reporters in early-stage embryos. Top: LeimohG; bottom: LhomieG. GFP is in green, lacZ is in orange, and DAPI is in blue. N=3, n=24 for both LeimohG and LhomieG. (G) Expression patterns of transgenic reporters in late-stage embryos. Top: LeimohG; bottom: LhomieG. N=3, n=24 for both LeimohG and LhomieG. Scale bars = 200 μm, N = # of independent biological replicates, n = # of embryos. Statistical analysis is in Supplementary file 1.

Figure 6—figure supplement 1. MicroC of LeimohG.

Figure 6—figure supplement 2. MicroC of LhomieG.

In the first version of the loop-extrusion model, the eve-gfp reporter in both LeimohG (Figure 6D) and LhomieG (not shown) should be activated by the eve enhancers, since it is included in the eveMa TAD when the transgenes are inserted so that eve-gfp is on the eve side of the homie boundary, and eve-lacZ will be regulated by the hebe enhancers (Figure 6D). In the second version of the loop-extrusion model, the functioning of the homie roadblock depends upon its orientation relative to endogenous homie. In this model, LeimohG is expected to form the eveMa TAD (Figure 6D), while LhomieG will form the larger eveGa TAD (Figure 6E).
As would be predicted by all three models, the eve enhancers activate the eve-gfp reporter in the LeimohG insert (Figure 6F and G). Likewise, homie blocks the hebe enhancers from activating the eve-gfp reporter, while they turn on eve-lacZ expression instead. As predicted by the boundary-pairing model, eve-dependent expression of the reporters switches from gfp to lacZ in the LhomieG insert (Figure 6F and G). This would not be expected in the first version of the loop-extrusion model, but it is predicted in the second version. However, as indicated in the diagram in Figure 6E, the two reporters, along with the hebe enhancers, are included in the larger eveGa TAD, and for this reason, both reporters should be activated equally by both the eve and hebe enhancers. This is not the case. The hebe enhancers are blocked by the intervening homie boundary, while there is little or no eve-dependent gfp expression.
TAD formation by transgenes inserted at –142 kb
We used MicroC to examine the TAD organization of the genomic region extending from upstream of the attP site through the eve locus in 12–16 hr embryos carrying different transgene insertions. At this stage, eve is expressed in only a small number of cells in the CNS, mesoderm, and anal plate, and hebe is also expressed in only a small subset of cells. This means that most of the interactions detected by MicroC are in cells in which both the eve gene and the two reporters are inactive. In addition, while the transgene co-localizes with eve in less than about a fifth of blastoderm stage nuclei (based on the fraction of cells within eve stripes that activate a transgene reporter) the frequency of physical contact is expected to be much higher in 12–16 hr embryos (Vazquez et al., 2006). This is because at this stage of development, cell cycles are much longer, providing more time for transgene – endogenous eve pairing to occur. The key findings are summarized below.
GlambdaL
While there is no evidence of contact between sequences in eve and sequences around the attP site at –142 kb in wild-type embryos, this not true for embryos carrying the dual reporter transgene. Perhaps the most unexpected finding is a weak, but clearly discernable, pattern of interaction linking the GlambdaL transgene to the eve locus (Figure 7A). However, since the GlambdaL transgene does not respond to the eve enhancers, this low level of physical interaction is not sufficient to drive detectable expression of the reporters. Although our experiments do not allow us to unequivocally identify which sequences in the transgene are responsible for this long-distance interaction, the most likely candidates are the two eve promoters in the GlambdaL transgene.
Figure 7. homie in transgenes GeimohL and GhomieL mediates long-range physical interactions with the eve TAD.

Diagrams for (A-C) yellow box: 5’ end of the hebe transcription unit. Transgene: green box: eve-gfp reporter, orange box: eve-lacZ reporter, black box: lambda DNA, red block arrow: homie DNA. eve TAD: blue block arrow: endogenous nhomie, red block arrow: endogenous homie; the directions of block arrows follow the established convention for nhomie and homie; gray boxes: eve enhancers, yellow box: eve transcription unit. (A) MicroC contact profile of the control GlambdaL. Inset shows a blow-up of the contacts between the GlambdaL transgene and the eve TAD. Note a slight increase in interaction frequency (compare to Figure 1A). (B, C) MicroC map of GeimohL and GhomieL, respectively. The key difference between the two inserts is the contacts between transgenes and sequences in the eve TAD. Note the changed pattern of interaction with the endogenous eve locus due to the orientation switch. (D) 'Virtual 4C’ maps obtained from MicroC maps of ‘B’ (top panel) and ‘C’ (bottom panel). Viewpoints are shown in both panels from either the lacZ gene (orange) or the GFP gene (green).
GeimohL
Unlike GlambdaL, the eve-lacZ reporter in the GeimohL insert is activated by the eve enhancers, and this regulatory interaction is perfectly paralleled by the strong pattern of crosslinking between the transgene and the eve locus (Figure 7B). On the eve side, the interactions between the transgene and the eve locus generate a heavily populated band of crosslinked sequences that span the 16 kb eve TAD. On the transgene side, there is an unequal distribution of crosslinked sequences to either side of the transgene homie boundary. As shown in the inset, the heaviest density of crosslinked sequences is on the eve-lacZ side of the transgene, consistent with the activation of this reporter by eve enhancers. To confirm that the interaction bias mimics the difference in activity of the two reporters in cells in which the reporters are expressed, we analyzed the interaction profiles from viewpoints within either the eve-lacZ or eve-gfp genes. Figure 7D shows that eve-lacZ interacts with sequences extending across the eve TAD, while eve-gfp interactions are largely restricted to the eve homie element. While these results would seemingly be consistent with both the boundary-pairing and loop-extrusion models, there is no evidence of cohesin breaking through multiple intervening boundaries into order to establish the novel eve(Mam) TAD. Instead, the organization of the TADs and LDC domains in the interval in between the transgene and eve (Figure 7B) resemble that seen in wild-type NC14 embryos (see Figure 2) (with the caveat that there are significantly fewer reads in the transgene experiment). Equally important, the same is true for the eve TAD. In order to generate the eve(Mam) TAD, the cohesin complex must break through the nhomie boundary and, in so doing, disrupt the eve TAD. However, there are no obvious alterations in either the eve volcano or plume with respect to their structure or relative contact density compared to the GlambdaL and wild type NC14 embryos. Likewise, there is no evidence of novel vertical and 45° crosslinking stripes that would reflect the boundary breakthrough events that are expected to accompany the formation of a physical connection between the transgene and the eve locus in the loop-extrusion model.
We next used the transgene homie as the viewpoint, to test the predictions of the boundary-pairing and loop-extrusion models. Since homie can pair with itself (head-to-head) and with nhomie (head-to-tail) in transvection assays (Fujioka et al., 2016), a prediction of the boundary-pairing model is that there will be physical interactions between the transgene homie and both homie and nhomie in the eve locus (Vazquez et al., 2006). Also based on what is known about how fly boundaries pair with each other (Chetverina et al., 2014; Chetverina et al., 2017; Kyrchanova et al., 2008a), self-interactions are expected to be stronger than heterologous interactions. In contrast, in the loop-extrusion model, the cohesin complex forms the eveMa TAD by linking homie in the transgene to homie in the eve locus, and this requires the cohesin complex to break through nhomie and disrupt the connections between nhomie and homie in the eve locus. In this case, transgene:homie←→eve:homie interactions should be observed, while transgene:homie←→eve:nhomie should not. Figure 8A shows that, as predicted by the boundary-pairing model, the transgene homie interacts with both homie and nhomie in the eve locus.
Figure 8. homie in the transgene interacts with eve homie and nhomie.
‘Virtual 4C’ maps of the GeimohL and LhomieG (A) or GhomieL and LeimohG (B) transgenes, oriented so that either lacZ (A) or gfp (B) is located upstream of the homie boundary in the transgene. (In the paired configuration, the reporter gene that is upstream of transgenic homie is the one that is brought closer to the endogenous eve enhancers, and so is the one that is expressed in an eve pattern.) Viewpoints are taken from the transgenic homie sequence. The major transgene peak (located toward the left end of each trace) is over the transgenic homie sequence in each case (it is in slightly different places in each pair of traces because the lacZ and gfp reporter genes are different sizes). Note that, in each case, transgenic homie interacts with endogenous homie (far right peak) more than it interacts with endogenous nhomie.

Figure 8—figure supplement 1. Blowup of interactions generated by the transgene with sequences neighboring –142 kb and the eve TAD.

Since the eve TAD does not appear to be disturbed by the presence of the GeimohL transgene, these findings would suggest that the transgene homie likely pairs with both nhomie and homie, in a pattern like that illustrated in Figure 3C. While the physical interactions between the transgene and eve boundaries are inconsistent with the loop-extrusion model, one could make the ad hoc assumption that runaway cohesin complexes form not one, but two different novel TADs. One would be eveMa. In the other, eveElephant (eveEl), a cohesin complex that initiates in, for example, the TE TAD would come to a halt on one side at the homie boundary in the transgene, and on the other side at the nhomie boundary in the eve locus (Figure 3—figure supplement 1). However, this configuration would not explain how the transgene reporter is activated by eve enhancers. Since the eve enhancers in eveEl are located in a different TAD than the TADs containing eve-lacZ and eve-gfp, they should not be able to activate either reporter.
GhomieL
When homie is reversed in the GhomieL transgene, the eve-gfp reporter, instead of eve-lacZ, responds to the eve enhancers. In the boundary-pairing model, eve-gfp is activated because self- and heterologous-pairing interactions between homie and nhomie are orientation-dependent. As a result, the topology of the loop formed between the transgene and eve is transformed in a way that brings the eve-gfp reporter, instead of eve-lacZ, into close proximity to the eve enhancers (see Figure 3E and F). Since only stem-loops can be generated in the loop-extrusion model, activation of the distal eve-gfp reporter would require the formation of a larger eveGa TAD in order to encompass both the transgene and the eve enhancers in the same looped domain (Figure 3G). However, as shown in Figure 7C, we do not observe the cross-linking pattern expected for a new eveGa TAD that includes the entire transgene at –142 kb and then extends to an even more distal boundary. Nor are there any novel vertical/45o crosslinking stripes or obvious perturbations in the basic TAD organization in the region beyond –142 kb, or between –142 kb and the eve locus, as might be expected for cohesin complexes breaking through multiple intervening roadblocks. Instead, as was the case for GeimohL, the GhomieL transgene is physically linked to the eve locus, and there is a prominent band of crosslinked transgene sequences that spans the eve TAD (Figure 7C). Consistent with the expression patterns of the two reporters, the heaviest density of crosslinked sequences is on the eve-gfp side of the transgene (see inset). This is confirmed by the interaction profiles generated using either the eve-gfp or eve-lacZ gene body as the viewpoint: the most frequent contacts are between sequences within eve and the eve-gfp reporter (Figure 7D). In addition, as was the case for GeimohL, when the transgene homie is used as the viewpoint, interactions are observed between both homie and nhomie in the eve locus, with the most frequent corresponding to self-pairing interactions (Figure 8B). Other than postulating the ad hoc eveEl TAD (Figure 3—figure supplement 1), this would not be expected for either version of the loop-extrusion model.
LhomieG and LeimohG
To confirm that the orientation of the homie boundary in the transgene is the key determinant of the physical interactions between the transgene reporters and the eve TAD, we used MicroC to analyze the TAD organization of LhomieG and LeimohG (Figure 6—figure supplements 1 and 2). Like their counterparts GhomieL and GeimohL, both show a strong band of interaction between the transgene and sequences spanning the eve locus. In the case of LeimohG, the pairing of the transgene homie with the endogenous homie is predicted to generate a stem-loop, while a more complicated multi-loop structure will be generated if it also pairs with nhomie (see Figure 6B). As shown in Figure 6—figure supplement 1A, these pairing interactions bring eve-gfp into contact with the eve enhancers and, as expected, the eve-gfp sequences interact more frequently with the eve locus than does eve-lacZ (inset Figure 6—figure supplement 1A). When homie is inserted in the transgene in opposite orientation, homie self-pairing is expected to generate a circle-loop, while the more complicated structure shown in Figure 6C will be formed if it also pairs with nhomie. While the sample preparation for MicroC was of poorer quality than the others, the inset in Figure 6—figure supplement 2 shows that, as expected, eve-lacZ interacts more frequently with sequences in the eve locus than does eve-gfp. On the other hand, there is no evidence of a larger eveGa TAD, even though eve-lacZ is activated by the eve enhancers. These interactions are confirmed when either eve-lacZ or eve-GFP is used as viewpoint to plot the physical contacts between the eve TAD and the two reporters in LhomieG and LeimohG (Figure 6—figure supplements 1B and 2B). In addition, as was the case for the GhomieL and GeimohL transgenes, when the transgene homie is used as the viewpoint, interactions are observed between homie in the transgene and both homie and nhomie in the eve locus (Figure 8A and B). Again, the most frequent interactions are self-pairing interactions between homie in the transgene and the eve homie.
Loop topology and interactions with neighbors
The results in the previous sections demonstrate that the orientation of homie in the transgene determines which of the two reporters physically interacts with sequences in the eve TAD, and this is independent of the orientation of the transgene in the chromosome. On the other hand, the orientation of the transgene homie in the chromosome impacts how sequences flanking the transgene homie and the eve TAD interact with each other. With the important caveat that the depth of our MicroC sequencing is limited, the interaction profiles reflect the topology of the transgene-induced loop. For homie pointing away from eve (GeimohL and LeimohG), sequences to the TER94 side of eve and to the hebe enhancer side of the transgene are more frequently crosslinked with each other (Figure 8—figure supplement 1). These interactions would be expected for either a stem-loop structure (as in Figure 3B) or a more complicated multi-loop structure like that shown in Figure 3C. For homie pointing towards eve, sequences on the TER94 side of eve interact with sequences on the eve side of the transgene. This would be expected for either a circle-loop structure (as in Figure 3E) or the more complicated multi-loop structure shown in Figure 3F (neither of which can be generated by a simple loop-extrusion mechanism).
Discussion
Two different mechanisms have been proposed to explain how TADs are formed and their endpoints determined. In the first, a cohesin complex first induces a small loop at a loading site within the TAD-to-be, and then progressively extrudes one or both strands until the complex encounters boundary roadblocks. If the loading site is located asymmetrically within the TAD-to-be, extrusion will continue on the unblocked strand until a roadblock is encountered. The endpoints of the loops were initially thought to be determined by the location of the first two roadblocks encountered by the cohesin complex (Alipour and Marko, 2012). In a refinement of this model, the orientation of a given roadblock relative to the direction of movement of the cohesin complex determines whether it will come to a halt (Davidson and Peters, 2021; Fudenberg et al., 2016; Guo et al., 2012; Guo et al., 2015; Sanborn et al., 2015). It has also been suggested that cohesin complexes can break through a roadblock and come to a halt at more distant roadblocks, so that in a population of cells analyzed by Hi-C or MicroC, the basic units of organization, the TADs, are overlaid by a hierarchy of LDC domains (Hsieh et al., 2020; Krietenstein et al., 2020). However, the only loop topologies that are possible in the loop-extrusion model are a stem-loop and an unanchored loop.
In the other mechanism, TAD formation is governed by boundary:boundary pairing interactions. In this case, the critical factors are the pairing and orientation preferences of potential partners, together with proximity. Since boundary pairing interactions often exhibit an orientation preference, the topology of the loop formed by paired boundaries can be either a stem-loop or a circle-loop, depending on their relative orientation in the chromosome. In this respect, it differs from the loop-extrusion model in that switching the orientation of the boundary does not preclude the formation of a TAD, whereas it can in some versions of the loop-extrusion model.
In the studies reported here, we have used MicroC to analyze the TAD organization of an ~150 kb chromosomal segment flanking the eve locus, and have experimentally tested the predictions of these two models for the mechanisms of TAD formation. Our studies do not support a loop-extrusion mechanism and are inconsistent with this model on multiple levels.
Manipulating ‘TAD’ formation
In our experimental paradigm, a transgene containing two divergently transcribed reporters and the eve boundary homie is inserted 142 kb upstream of the eve TAD. Depending upon the orientation of the homie boundary within the transgene, either eve-gfp or eve-lacZ is activated by developmentally regulated enhancers in the eve TAD. Since there are a series of well-defined TADs and their associated boundary elements separating the transgene from eve, a version of the loop-extrusion model in which the cohesin complex invariably arrests upon encountering nhomie and homie at the ends of the eve TAD cannot account for this long-distance regulation. Instead, the extruding cohesin complex must be able to break through the boundaries located between homie in the transgene and homie in the eve TAD. This would generate a novel TAD, eveMa, with endpoints corresponding to the two homie boundaries (Figure 3D). In this case, the reporter on the eve side of the transgene homie would be in the same domain as the eve enhancers, and thus potentially subject to regulation. While eveMa could account for reporter expression in inserts in which the transgene homie is pointing away from eve (and also away from the reporter on the eve side of the transgene insert), it does not explain reporter expression when the transgene homie is pointing towards eve (and in this case towards the reporter on the eve side of the transgene insert). In the latter case, the reporter activated by the eve enhancers lies outside of the eveMa (cf., Figure 3D), and thus is not included in the same TAD as the eve enhancers. In order to account for activation of the distal reporter, one must imagine that the cohesin complex breaks through the homie boundary in the transgene and continues on until extrusion is halted by an even more distal boundary. In this revision of the loop-extrusion model, both reporters would be included in the same TAD as the eve enhancers (c.f., Figure 3G, eveGa), and both reporters should be activated. However, this is not observed.
TAD organization: loop extrusion versus boundary pairing
Analysis of the TAD organization in the region spanning the transgene insertion site and eve also does not fit with the expectations of the loop-extrusion model. To account for reporter activation, the cohesin complex must be able to break through the nhomie boundary. This breakthrough could be engineered by a cohesin complex that initiated loop extrusion either from within the eve TAD or from one of the TADs located between the nhomie boundary and the transgene at –142 kb. However, in the absence of the transgene, there is no indication that nhomie is particularly prone to break-through events. In fact, the eve TAD differs from most of the TADs in between eve and the transgene in that it is incorporated into larger LDC domains much less frequently. There is also no reason to imagine that the presence of a transgene carrying homie (or nhomie: see Fujioka et al., 2016) at –142 kb would somehow induce nhomie break-through events.
As expected from the regulatory interactions, homie-containing transgenes at –142 kb generate a strong band of crosslinking events that physically link the transgene to the eve locus. In the loop-extrusion model, this strong band of interaction should generate a novel interaction triangle (LDC or HDIC) with endpoints corresponding to the homie elements in the transgene and eve. Contrary to this expectation, a triangle of increased interaction frequencies spanning the entire region between –142 kb and homie is not observed for any of the transgene inserts. In viewpoints from the homie element in the GeimohL and LeimohG transgenes, there are two peaks in the eve TAD. The more prominent peak maps to homie, while the less prominent peak maps to nhomie. To account for these interaction peaks, the loop-extrusion model would have to assume that the presence of the GeimohL and LeimohG transgenes induces the formation of two novel TADs, the eveMa (homie:homie) TAD in Figure 3D and another TAD, eveElephant, that links the transgene homie to the nhomie element in the eve locus (Figure 3—figure supplement 1B). However, while the eveMa TAD could potentially explain the activation of reporters on the proximal side of the transgene homie by the eve enhancers, these TADs do not explain how the eve enhancers are able to activate reporters on the distal (hebe enhancer) side of the GhomieL and LhomieG transgene. This would require the formation of yet another TAD, eveGa, that encompasses eve, the transgene, and one or more TADs beyond the hebe gene (Figure 3G). However, there is no indication of physical interactions between the homie boundary in eve and a boundary located beyond the hebe gene. Moreover, like eveMa, eveGa would also have to be accompanied by the formation of eveEl, since the homie element in GhomieL and LhomieG interacts with both nhomie and homie.
While these results are inconsistent with the expectations of the loop-extrusion model, they dovetail nicely with many of the predictions of the boundary-pairing model. First, in all four transgenes, homie interacts with both homie and nhomie in the eve locus, but does not interact with the multiple boundary elements located in between. This is consistent with other studies which show that boundaries often have strong partner preferences (Gohl et al., 2011; Kyrchanova et al., 2011; Kyrchanova et al., 2008b). Second, interaction frequencies are greater for self-pairing than for heterologous pairing. This fits with what is known about how partner preferences are determined (Blanton et al., 2003; Chetverina et al., 2017; Erokhin et al., 2021; Kyrchanova et al., 2008a; Zolotarev et al., 2016). Third, the pattern of reporter activation in the four transgenes is precisely as expected from previous studies on the orientation dependence of homie pairing with itself (head-to-head) and with nhomie (head-to-tail) (Chen et al., 2018; Fujioka et al., 2016). This orientation dependence means that the reporter located ‘upstream’ of homie is the one that is activated, independent of the orientation of the transgene in the chromosome. Fourth, the pattern of physical interactions between the eve locus and each of the transgenes matches the pattern of reporter activation. That is, when eve-lacZ sequences are preferentially crosslinked to sequences in the eve locus, then the eve-lacZ reporter is activated by the eve enhancers. Likewise, eve-gfp is preferentially crosslinked to sequences in eve when it is activated by the eve enhancers. Again, this is dependent on the orientation of homie in the transgene, but not on the orientation of the transgene in the chromosome. Fifth, unlike the loop-extrusion model where only stem-loops or unanchored loops can be generated, stem-loops, circle-loops and even more complicated structures can be, and, as we have shown here, actually are generated by boundary:boundary pairing.
Are the pairing interactions of homie and nhomie unusual?
There are two reasons to think that the properties of most fly boundaries are similar to those of homie and nhomie. First, all the fly boundaries that have been tested in assays that are expected to require pairing do have this activity (Blanton et al., 2003; Cai and Shen, 2001; Erokhin et al., 2011; Gohl et al., 2011; Kyrchanova et al., 2008a; Kyrchanova et al., 2011; Kyrchanova et al., 2007; Kyrchanova et al., 2008b; Muravyova et al., 2001).
Second, multimerized binding sites for generic polydactyl zinc finger proteins like Su(Hw), Pita, dCTCF, Zw5, and Zipic that are found associated with many fly boundaries are not only able to block enhancer/silencer action but can also mediate pairing interactions in insulator bypass and transvection assays (Erokhin et al., 2021; Kyrchanova et al., 2008a; Zolotarev et al., 2016). Moreover, as is the case for homie and nhomie, pairing interactions require the appropriate partners: multimerized sites for Zw5 do not pair with multimerized sites for dCTCF (Erokhin et al., 2021; Kyrchanova et al., 2008a; Zolotarev et al., 2016). This makes good sense, since these proteins form dimers/multimers, as do other fly boundary factors like BEAF, Mod(mdg4), the BEN-domain protein Insensitive, and the Elba complex (Avva and Hart, 2016; Bonchuk et al., 2021; Bonchuk et al., 2011; Bonchuk et al., 2020; Fedotova et al., 2018; Fedotova et al., 2019; Fedotova et al., 2017; Hart et al., 1997). The ability to multimerize means that boundaries that share binding sites for the same protein, that is, for Pita, Zipic, or CTCF, can be physically linked to each other by a single protein complex.
Third, homie and nhomie are not the only examples of fly boundary elements that engage in specific orientation-dependent physical pairing interactions. In addition to gypsy, Mcp, and Fab-7, Mohana et al., 2023 identified nearly 60 meta-loops in which distant TADs are linked together by what appears in most instances to be orientation-dependent boundary pairing interactions. Figure 9 shows the MicroC contact profiles generated for two such meta-loops in 12–16 hr embryos. As observed in our homie transgene experiments, the meta-loop in panel A is formed by specific and orientation-dependent boundary:boundary (blue:purple) pairing interactions that bring together distant TADs. The blue boundary splits the Leukocyte-antigen-related like (Lar) gene into a small upstream TAD that contains the most distal promoter (black arrowhead), and a larger downstream TAD whose endpoint is close to an internal Lar promoter (green arrowhead). The purple boundary is located ~600 kb away on the left arm of the 2nd chromosome, between two TADs, Pa and Pb, in a gene poor region. The pairing of the blue and purple boundaries generates two rectangles of enhanced contacts. The one on the upper left corresponds to interactions of the sequences in the small TAD just upstream of the blue boundary with sequences in the Pa TAD located upstream of the purple boundary. The other box on the lower right is generated by interactions between sequences in the TAD downstream of the blue boundary and sequences downstream of the purple boundary. Based on the locations of interacting TADs, the blue and purple boundaries pair with each other head-to-head, generating the circle-loop in the diagram.
Figure 9. Circle-loop and stem-loop meta-loops.

Distant boundary elements can find and pair with each other, forming large meta-loops. (A) Shows a circle-loop meta-loop formed by the head-to-head pairing of the blue (blue arrow) and purple (purple arrow) boundaries. As described in the text, the blue boundary separates a small TAD that contains the most distal Lar promoter (indicated by the black arrowhead) and a larger TAD that contains part of the Lar transcription unit (and is upstream of an internal Lar promoter: green arrowhead). The purple boundary is located between two TADS, Pa and Pb, in a gene-poor region of the 2nd chromosome approximately 600 kb away, downstream of the Lar gene. When the blue and purple boundaries pair, sequences in the small TAD upstream of the blue boundary come into contact with sequences in the Pa TAD upstream of the purple boundary. This interaction generates the dark rectangle on the upper left side of the interaction plot. Sequences downstream of the blue boundary in the TAD containing part of the Lar transcription unit are also brought into contact with sequences in the Pb TAD downstream of the purple boundary. This interaction generates the larger rectangular box on the bottom right side of the interaction plot. Shown in the diagram on the right is a schematic illustrating that the head-to-head pairing of the blue and purple boundaries generates a~600 kb circle-loop. In the circle-loop configuration, sequences in the TADs upstream of the blue and purple boundaries come into contact with each other, as do sequences downstream of the blue and purple boundaries (blue double arrows). (B) Shows a stem-loop meta-loop formed by the head-to-tail pairing of a boundary (blue arrow) located upstream of the beat IV gene with another boundary (purple arrow) located ~6 Mb away, between the Sid and snu genes. The blue boundary separates a small TAD containing three UDP-glycosyltransferase genes from a larger TAD containing the CG10164 gene and the distal-most promoter of the beat IV gene. The purple boundary separates a ~20 kb TAD containing Sid and four other genes from a small TAD that contains the most distal snu promoter (green arrowhead). When the blue and purple boundaries pair with each other head-to-tail (see diagram on right), this interaction brings sequences in the large TAD downstream of the blue boundary into contact with sequences upstream of the purple boundary in the 20 kb Sid TAD, and this generates the large rectangular box to the lower left of interaction map. The stem-loop configuration also brings sequences upstream of blue boundary in the small TAD containing the three UDP-glycosyltransferase genes into contact with the TAD containing the distal-most snu promoter. This interaction gives a small rectangular box with a high contact density. Sequences in the TAD upstream of the UDP-glycosyltransferase TAD are also brought into contact with the small TAD containing the snu promoter. These two interacting ‘zones’ are indicated by blue double arrows in the diagram on right. In addition to boundary:boundary pairing, both meta-loops have a prominent dot in the larger rectangular boxes indicated by the green (panel A) and blue (panel B) arrows. Based on the ChIP signature of the sequences giving rise to these dots, they likely correspond to elements that are bound by the GAF-containing LBC complex, as indicated in the figure (‘LBC’ in both panels). LBC elements in other contexts function to bring enhancers into contact with promoters (Batut et al., 2022; Kyrchanova et al., 2023; Kyrchanova et al., 2019a; Kyrchanova et al., 2019b; Levo et al., 2022).
The meta-loop in panel B links a boundary (blue arrow) to a boundary (purple arrow) ~5 Mb away on the right arm of the 3rd chromosome. The blue boundary is located between a small TAD that contains three genes encoding UDP-glycosyltransferases and a larger TAD that includes CG10164 and the most distal beat IV (beaten path IV) promoter. The purple boundary separates a large TAD containing five genes (Sid, CG33346, CG31050, CG14062, and CG9988) from a small TAD that contains the most distal promoter of the snu (snustorr) ABC transporter. The blue and purple boundaries pair with each other head-to-tail, and this generates a stem-loop meta-loop (see diagram). In this pairing configuration, sequences upstream of the blue boundary come into contact with sequences downstream of the purple boundary. This generates a box of interactions between the small TAD that contains the UDP-glycosyltransferase gene cluster and the small TAD that contains the most distal snu promoter. (Another, weaker rectangular block of interactions links sequences in the TAD immediately upstream of the UDP-glycosyltransferase gene cluster, which contains CG10175, and the small TAD containing the distal snu promoter). A second, larger rectangular box is generated by contacts between sequences in the TADs downstream of the blue boundary and upstream of the purple boundary. Note that the positioning of the rectangular interaction boxes differs for circle-loops and stem-loops.
The pairing interactions in the Lar and beat IV meta-loops are much simpler than those seen for homie in the dual reporter. In both cases, there is only a single contact point (blue:purple boundaries). In contrast, as shown in Figure 7 and in Figure 6—figure supplements 1 and 2, the interaction between the dual reporter homie and the eve TAD generates a ‘stripe’ that spans the eve TAD together with crosslinking events between TADs upstream and downstream of the dual reporters and TADs located to either side of the eve TAD. This more complicated interaction pattern is consistent with the viewpoint analysis (Figure 8), which shows that the transgene homie physically interacts with both homie and nhomie in the eve TAD.
Boundary pairing orientation and loop topology
Our analysis of the TAD organization in the eve neighborhood suggests that the predominant loop topology may be a circle-loop, not a stem-loop. Only the eve TAD (and perhaps the very small TAD TA) is clearly a stem-loop. It is topped by a distinctive volcano plume and is not overlaid by a hierarchy of LDC domains, indicating that it must be “insulated” from crosslinkable interactions with other, nearby TADs. By contrast, none of the TADs in the region spanning eve and the hebe gene have volcano plumes at their apex. Instead, all of these TADs are overlaid by a hierarchal organization of LDC domains (clouds) that diminish in crosslinking intensity as the number of in-between TADs increases. As discussed above, the contact pattern of the TADs to the left of eve are likely to arise from partner switching and/or head-to-head boundary pairing interactions that generate circle-loops. Pairing orientation versus loop topology is considered further in the accompanying paper (Ke et al., 2024).
Orientation and long-distance regulatory interactions
Our experiments highlight an important constraint on long-distance regulatory interactions that are mediated not only by boundary elements like homie, nhomie, and the meta-loop boundaries in Figure 9, but also by the GAF-dependent (LBC) tethering and bypass elements (Batut et al., 2022; Kyrchanova et al., 2023; Kyrchanova et al., 2018; Kyrchanova et al., 2019a; Kyrchanova et al., 2019b; Levo et al., 2022; Li et al., 2023; Mohana et al., 2023), namely the orientation of the physical interactions that bring distant enhancers (or silencers) into close proximity with their gene targets. As we have shown here, the orientation of the physical interactions that bring distant sequences close together determines whether the enhancer will be able to activate its target gene. In principle, the effects of orientation could be mitigated by increasing (or decreasing) the distance between the boundary/tethering elements and either the enhancers (silencers) or the promoter. However, distance can be a critical, rate-limiting step in transcriptional activation. For example, live imaging experiments have shown that the frequency and amplitude of transcriptional bursts depend on the distance between the enhancer and target promoter. Nearly continuous bursting and high amplitude transcription were observed when the enhancer was located close the promoter (Fukaya et al., 2016). However, at distances as little as 6 kb, transcription became discontinuous with discrete bursts, while at 9 kb, the bursts were much less frequent, and the amplitude/output was substantially reduced (Yokoshi et al., 2020). If similar distance-dependent reductions in transcriptional efficiency are common, then it would not be possible to overcome the topological constraints on regulatory interactions by simply changing the distance between the boundary/tethering elements and the enhancers/promoters. While our studies do not directly address how chromosome architecture impacts regulatory interactions in vertebrates, it seems likely that long-distance regulatory interactions in vertebrates (Tan et al., 2023) will be subject to the same types of topological constraints as those that apply in flies.
Materials and methods
Plasmid construction and transgenic lines
The dual reporter constructs were described previously (Fujioka et al., 2016). In short, both reporters contain the eve basal promoter (–275 to +106 bp relative to eve start site), the lacZ (eve-lacZ) or EGFP (eve-gfp) coding region, and the eve 3’ UTR (+1,300 to +1525 bp). The two reporters are divergently transcribed. The 367 bp homie fragment, or a 500 bp fragment from lambda phage DNA, was placed between the two reporters. For the homie fragment, it was inserted into the transgene in both orientations, giving eve-gfp:homie:eve-lacZ (in GhomieL and LeimohG) and eve-gfp:eimoh:eve-lacZ (in GeimohL and LhomieG).
The –142 kb attP landing site was described previously (Fujioka et al., 2009). The –142 kb site contains two attP target sites for phiC31 recombinase-mediated cassette exchange (RMCE; Bateman et al., 2006) and mini-white as a marker. RMCE can result in the insertion of the transgene in either orientation, and all four possible insertions of the two transgenes were recovered. For two of these, GeimohL and GhomieL, the eve-lacZ reporter is on the eve side of the transgene homie, while eve-gfp is on the hebe enhancers side of the transgene homie. For the other two, LeimohG and LhomieG, the eve-gfp reporter is on the eve side of transgene homie, while eve-lacZ is on the hebe enhancers side of the transgene homie. RMCE events were identified by loss of mini-white, and the orientation of each insert was determined by PCR. All the new fly stocks described in this paper are available upon request.
smFISH probe preparation
The sequences of target genes were obtained from FlyBase (flybase.org, Gramates et al., 2022). To design probes, the target gene sequences were submitted to the Biosearch Technologies Stellaris RNA FISH probe designer tool (biosearchtech.com), with parameters set to 20nt probes, 48 probes per gene, and mask level 5 for Drosophila melanogaster. The sequences of the probes used are listed in Supplementary file 2. The probes with 3' MdC(TEG-Amino) modifications were then ordered from Biosearch Technologies in 96-well plate format, cartridge purification and salt free conditions, and in 5 nmol scale. To prepare the fluorophore for probe labeling, the Sigma Atto NHS ester fluorophore (Atto 565 NHS or Atto 633 NHS) was dissolved in dimethylformamide at 5 mg/mL as the stock solution. For probe labeling, 1 nmol of each probe was combined and mixed with Atto NHS ester fluorophore at 1 mg/mL in 500 μL of 0.1 M sodium bicarbonate (pH 8.0–8.5) for 2 hr, and the probes were then precipitated with 0.5 M potassium acetate (pH 5.2) in 75% EtOH. Then, the probes were dried and resuspended in 50 μL of DEPC-treated H2O. The probes were then injected into HPLC columns in which the percentage 0.1 M triethylammonium acetate varied from 7% to 30% with a flow rate of 1 mL/min. To monitor coupled probes during the HPLC purification, the detector was set to 260 nm for DNA and to the absorption wavelength of the coupled fluorophore. The coupled probes were collected when both 260 nm and the absorption wavelength channel were detected. The coupled probes were then dried and diluted to the appropriate concentration for smFISH experiments in DEPC-treated H2O.
smFISH
smFISH methods were adapted and modified from previous studies (Little and Gregor, 2018; Trcek et al., 2017). 100–200 flies were placed in a cage with an apple juice plate at the bottom of the cage. Early-stage embryos were collected for 7 hr, while for later-stage embryos, collection was overnight. Embryos from each plate were washed into collection mesh and dechorionated in bleach for 2 min, then fixed in 5 mL of 4% paraformaldehyde in 1 X PBS and 5 mL of heptane for 15 min with horizontal shaking. The paraformaldehyde was then removed and replaced with 5 mL methanol. The embryos were then devitellinized by vortexing for 30 s, and washed in 1 mL of methanol twice. Methanol was then removed and replaced by PTw (1 X PBS with 0.1% Tween-20) through serial dilution at 7:3, 1:1, and 3:7 methanol:PTw. The embryos were washed twice in 1 mL PTw and then twice in 1 mL smFISH wash buffer (4 X SSC, 35% formamide and 0.1% Tween-20). Embryos were incubated with ~5 nM coupled smFISH probes in hybridization buffer (0.1 g/mL dextran sulfate, 0.1 mg/mL salmon sperm ssDNA, 2 mM ribonucleoside vanadyl complex, 20 μg/mL RNAse-free BSA, 4 X SSC, 1% Tween-20 and 35% formamide) for 12–16 h. Embryos were then washed twice for 2 hr in 1 mL smFISH wash buffer, followed by 4 X washing in 1 mL PTw. For DAPI/Hoechst staining, the embryos were stained with 1 ug/mL DAPI or Hoechst in PTw, and washed 3 X with 1 mL PTw. Finally, the embryos were mounted for imaging on microscope slides with Aqua PolyMount and a #1.5 coverslip.
Imaging, image analysis, and statistics
Embryos from smFISH were imaged using a Nikon A1 confocal microscope system with a Plan Apo 20 X/0.75 DIC objective. Z-stack images were taken at intervals of 2 μm, 4 X average, 1024 x 1024 resolution, and the appropriate laser power and gain were set for 405, 561, and 640 channels to avoid overexposure. Images were processed using ImageJ, and the maximum projection was applied to each of the stack images. To measure the stripe intensity of early embryos, multi-channel images were first split into single channels and the stripe signal was highlighted and selected by the MaxEntropy thresholding method. For APR intensity measurements, the ROI tool was used to crop out the APR region of late-stage embryos. The cells with APR signal were also highlighted and selected by MaxEntropy thresholding. The particle measurement tool was used to measure the average intensity of all cells that had a signal. At the same time, the background signal (average intensity) was taken from cells without a signal in the same embryo. The relative intensity (signal to background) for each embryo was calculated using the stripe signal and background from the same embryo. To make comparisons between independent biological replicates, the average background signal of all embryos from each replicate was calculated. The relative intensity of each embryo from each replicate was normalized based on the average background signal of all embryos from same replicates. GraphPad Prism was used for data visualization and statistical analysis. To compare intensity from embryos in different groups, different signals from the same embryo (e.g. lacZ and GFP) were paired, and paired two-tailed t-tests were used to calculate p-values. All raw measurements and normalized data are included in Supplementary file 3.
MicroC library construction
Embryos were collected on yeasted apple juice plates in population cages for 4 hr, incubated for 12 hr at 25℃, then subjected to fixation as follows. Embryos were dechorionated for 2 min in 3% sodium hypochlorite, rinsed with deionized water, and transferred to glass vials containing 5 mL PBST (0.1% Triton-X100 in PBS), 7.5 mL n-heptane, and 1.5 mL fresh 16% formaldehyde. Crosslinking was carried out at room temperature for exactly 15 min on an orbital shaker at 250 rpm, followed by addition of 3.7 mL 2 M Tris-HCl pH7.5 and shaking for 5 min to quench the reaction. Embryos were washed twice with 15 mL PBST and subjected to secondary crosslinking. Secondary crosslinking was done in 10 mL of freshly prepared 3 mM final DSG and ESG in PBST for 45 min at room temperature with passive mixing. The reaction was quenched by addition of 3.7 mL 2 M Tris-HCl pH7.5 for 5 min, washed twice with PBST, snap-frozen, and stored at –80℃ until library construction.
Micro-C libraries were prepared as previously described (Batut et al., 2022) with the following modifications: 50 uL of 12–16 hr embryos were used for each biological replicate. Sixty U of MNase was used for each reaction to digest chromatin to a mononucleosome:dinucleosome ratio of 4. Libraries were barcoded, pooled, and subjected to paired-end sequencing on an Illumina Novaseq S1 100 nt Flowcell (read length 50 bases per mate, 6-base index read).
MicroC data processing
MicroC data for D. melanogaster were aligned to custom genomes edited from the Berkeley Drosophila Genome Project (BDGP) Release 6 reference assembly (dos Santos et al., 2015) with BWA-MEM (Li and Durbin, 2009) using parameters -S -P –5 M. Briefly, the custom genomes are simply insertions of the transgenic sequence into the –142 kb integration site, as predicted from perfect integration. These events were confirmed using PCR post-integration. The resultant BAM files were parsed, sorted, de-duplicated, filtered, and split with Pairtools (https://github.com/open2c/pairtools; Goloborodko, 2024) . We removed pairs where only half of the pair could be mapped, or where the MAPQ score was less than three. The resultant files were indexed with Pairix (https://github.com/4dn-dcic/pairix; Lee, 2024). The files from replicates were merged with Pairtools before generating 100 bp contact matrices using Cooler (Abdennur and Mirny, 2020). Finally, balancing and Mcool file generation was performed with Cooler’s Zoomify tool.
Virtual 4C profiles were extracted from individual replicates using FAN-C (Kruse et al., 2020) at 400 bp resolution. The values were summed across replicates and smoothed across three bins (1.2 kb). Viewpoints were determined based on the most informative region for interpretation. Ultimately we decided to use 800 bp regions in the gene body of either GFP or lacZ, moving downstream from the eve promoter. However, similar results were obtained using viewpoints between transgenic homie and the promoters of either gene. For homie viewpoints, due to transgenic homie being masked, some loss of signal is expected at the viewpoint (Figures 7D and 8).
Acknowledgements
We thank Gordon Grey for running the fly food facility at Princeton, members of the Lewis Sigler Genomics Core facility for their invaluable assistance with DNA sequencing, and Sergey Ryabichko for his help with smFISH probes. We would also like to thank members of MOL431 for creative input. Special thanks to Qing Liu for invaluable technical assistance, and to Olga Kyrchanova, Daria Chetverina, Maksim Erokhin, Pavel Georigev, Tsutomu Aoki, Girish Deshpande, Airat Ibragimov, Sergey Ryabichko, Yuri Pritykin and Alex Ostrin for stimulating discussions and sharing unpublished data.
Appendix 1
Appendix 1—key resources table.
| Reagent type (species) or resource | Designation | Source or reference | Identifiers | Additional information |
|---|---|---|---|---|
| Gene (Drosophila melanogaster) | eve | Flybase | FBgn0000606 | |
| Gene (D. melanogaster) | hebe | Flybase | FBgn0033448 | |
| Genetic reagent (D. melanogaster) | eve-lacZ:homie:eve-gfp | Fujioka et al., 2016 | ||
| Genetic reagent (D. melanogaster) | eve-lacZ:eimoh:eve-gfp | Fujioka et al., 2016 | ||
| Genetic reagent (D. melanogaster) | eve-gfp:homie:eve-lacZ | Fujioka et al., 2016 | ||
| Genetic reagent (D. melanogaster) | eve-gfp:eimoh:eve-lacZ | Fujioka et al., 2016 | ||
| Chemical compound, drug, solution | n-Heptane | Fisher Chemical | O3008-4 | |
| Chemical compound, drug, solution | Paraformaldehyde 20% solution, EM Grade | Electron Microscopy Sciences | 15,713 S | |
| Chemical compound, drug, solution | Formaldehyde, 16%, methanol free, Ultra Pure | Polysciences Inc | 18814–10 | |
| Chemical compound, drug, solution | PBS - Phosphate-Buffered Saline (10 X) pH 7.4, RNase-free | Thermo Fisher | AM9624 | |
| Chemical compound, drug, solution | Tween 20 | Sigma | P1379 | |
| Chemical compound, drug, solution | Triton X-100 | Bio-Rad | 161–0407 | |
| Chemical compound, drug, solution | Tris base | Sigma | 11814273001 | |
| Chemical compound, drug, solution | Methanol | Fisher Chemical | 203403 | |
| Chemical compound, drug, solution | SSC, 20 X | Thermo Fisher | 15557044 | |
| Chemical compound, drug, solution | Formamide | Thermo Fisher | 17899 | |
| Chemical compound, drug, solution | Dextran sulfate | Sigma | D8906 | |
| Chemical compound, drug, solution | Salmon Sperm DNA | Thermo Fisher | AM9680 | |
| Chemical compound, drug, solution | Ribonucleoside Vanadyl Complex | NEB | S1402S | |
| Chemical compound, drug, solution | Nuclease-free BSA | Sigma | 126609 | |
| Chemical compound, drug, solution | Triethylammonium Acetate | Sigma | 625718 | |
| Chemical compound, drug, solution | dGTP (100 MM) | VWR | 76510–208 | |
| Chemical compound, drug, solution | dTTP (100 MM) | VWR | 76510–224 | |
| Chemical compound, drug, solution | Lonza NuSieve 3:1 Agarose | Thermo Fisher | BMA50090 | |
| Other | T4 DNA ligase | NEB | M0202L | enzyme |
| Chemical compound, drug, solution | Biotin-11-dCTP | Jena Bioscience | NU-809-BIOX | |
| Chemical compound, drug, solution | Biotin-14-dATP | Jena Bioscience | NU-835-BIO14 | |
| Commercial assay or kit | Qubit dsDNA HS Assay Kit | Life Technologies Corp. | Q32851 | |
| Chemical compound, drug, solution | Atto 633 NHS ester | Sigma | 01464 | |
| Chemical compound, drug, solution | Phase Lock Gel, QuantaBio - 2302830, Phase Lock Gel Heavy | VMR | 10847–802 | |
| Commercial assay or kit | NEBNext Ultra II DNA Library Prep Kit for Illumina | NEB | E7645S | |
| Commercial assay or kit | Ampure Xp 5 ml Kit | Thermo Fisher | NC9959336 | |
| Commercial assay or kit | Hifi Hotstart Ready Mix | Thermo Fisher | 501965217 | |
| Commercial assay or kit | Dynabeads MyOne Streptavidin C1 | Life Technologies Corp. | 65001 | |
| Chemical compound, drug, solution | cOmplete, EDTA-free Protease Inhibitor Cocktail | Sigma | 11873580001 | |
| Chemical compound, drug, solution | N,N-Dimethylformamide | Sigma | 227056 | |
| Chemical compound, drug, solution | Potassium acetate solution | Sigma | 95843 | |
| Chemical compound, drug, solution | DSG (disuccinimidyl glutarate) | Thermo Fisher | PI20593 | |
| Other | T4 Polynucleotide Kinase - 500 units | NEB | M0201S | enzyme |
| Other | DNA Polymerase I, Large (Klenow) Fragment - 1000 units | NEB | M0210L | enzyme |
| Commercial assay or kit | End-it DNA End Repair Kit | Thermo Fisher | NC0105678 | |
| Other | Proteinase K recomb. 100 mg | Sigma | 3115879001 | enzyme |
| Other | Nuclease Micrococcal (s7) | Thermo Fisher | NC9391488 | enzyme |
| Chemical compound, drug, solution | EGS (ethylene glycol bis(succinimidyl succinate)) | Thermo Fisher | PI21565 | |
| Commercial assay or kit | Atto 565 NHS ester | Sigma | 72464 | |
| Sequence-based reagent | WK_LacZ_probeset | Biosearch Technologies | Custom FISH probe set | see Supplementary file 2 |
| Sequence-based reagent | WK_GFP_probeset | Biosearch Technologies | Custom FISH probe set | see Supplementary file 2 |
| Sequence-based reagent | WK_eve_probeset | Biosearch Technologies | Custom FISH probe set | see Supplementary file 2 |
| Commercial assay or kit | NEBNext Multiplex Oligos for Illumina | NEB | E7335S | |
| Commercial assay or kit | Dig RNA labeling mixture | Roche | 11277073910 | |
| Commercial assay or kit | T7 RNA polymerase | Roche | 10881767001 | |
| Commercial assay or kit | NEB IN solution | Roche | 11383213001 | |
| Commercial assay or kit | BCIP X-PHOS IN solution | Roche | 11383221001 | |
| Commercial assay or kit | ant-digoxigenin-ap | Roche | 11093274910 | |
| Software, algorithm | Fiji (ImageJ) | Schindelin et al., 2012 | fiji.sc | |
| Software, algorithm | NIS element | Nikon | https://microscope.healthcare.nikon.com/products/software/nis-elements | |
| Software, algorithm | GraphPad Prism 8 | GraphPad Software | https://www.graphpad.com/ | |
| Software, algorithm | HiGlass | Kerpedjiev et al., 2018 | https://higlass.io/app | |
| Software, algorithm | bwa | Li and Durbin, 2009 | https://bio-bwa.sourceforge.net/ | |
| Software, algorithm | samtools | GitHub/open source | https://samtools.github.io/ | |
| Software, algorithm | pairsamtools | Goloborodko et al., 2024 | https://github.com/mirnylab/pairsamtools | |
| Software, algorithm | pairix | Lee, 2024 | https://github.com/4dn-dcic/pairix | |
| Software, algorithm | cooler | Abdennur and Mirny, 2020; Abdennur, 2016 | https://github.com/open2c/cooler | |
| Software, algorithm | Miniconda | Anaconda | https://docs.anaconda.com/miniconda.html | |
| Software, algorithm | Snakemake | GitHub/open source | https://snakemake.github.io/ |
Funding Statement
The funders had no role in study design, data collection and interpretation, or the decision to submit the work for publication.
Contributor Information
Paul Schedl, Email: pschedl@princeton.edu.
Mia T Levine, University of Pennsylvania, United States.
Claude Desplan, New York University, United States.
Funding Information
This paper was supported by the following grants:
National Institute of General Medical Sciences R35 GM118147 to Mike Levine.
National Institute of Diabetes and Digestive and Kidney Diseases U01 DK127429 to Mike Levine.
National Institute of General Medical Sciences R01 GM137062 to James B Jaynes.
New Jersey Commission on Cancer Research COCR23PDF011 to Wenfan Ke.
Histochemical Society Keystone Grant to Wenfan Ke.
National Institute of General Medical Sciences R35 GM126975 to Paul Schedl.
Additional information
Competing interests
currently employed by a biotech company; however, this author's experimental contributions to the paper were done prior to taking the biotech job.
No competing interests declared.
Author contributions
Data curation, Formal analysis, Investigation, Methodology.
Data curation, Formal analysis, Investigation, Methodology.
Data curation, Formal analysis, Investigation, Methodology.
Investigation.
Investigation.
Supervision, Funding acquisition.
Conceptualization, Supervision, Writing - original draft, Writing - review and editing.
Conceptualization, Supervision.
Additional files
Data availability
Sequence data are available at GEO GSE263229. Confocal images are available on Open Science Framework at https://doi.org/10.17605/OSF.IO/VNGAK. Raw measurements are in Supplementary file 3.
The following datasets were generated:
Bing X, Bing X, Ke W, Fujioka M, Kurbidaeva A, Levitt S, Levine M, Schedl P, Jaynes J. 2024. Chromosome Structure I: Loop extrusion or boundary:boundary pairing? NCBI Gene Expression Omnibus. GSE263229
Ke W. 2024. Chromosome structure in Drosophila is determined by boundary pairing not loop extrusion. Open Science Framework. vngak
The following previously published datasets were used:
Bing X, Bing X, Batut P, Levine M. 2022. Genome organization controls transcriptional dynamics during development. NCBI Gene Expression Omnibus. GSE171396
Bing X, Bing X, Levo M, Raimundo J, Levine M. 2022. Transcriptional Coupling of Distant Regulatory Genes in Living Embryos. NCBI Gene Expression Omnibus. GSE173518
References
- Abdennur N. Cooler. v0.9.3GitHub. 2016 https://github.com/open2c/cooler
- Abdennur N, Mirny LA. Cooler: scalable storage for Hi-C data and other genomically labeled arrays. Bioinformatics. 2020;36:311–316. doi: 10.1093/bioinformatics/btz540. [DOI] [PMC free article] [PubMed] [Google Scholar]
- Alipour E, Marko JF. Self-organization of domain structures by DNA-loop-extruding enzymes. Nucleic Acids Research. 2012;40:11202–11212. doi: 10.1093/nar/gks925. [DOI] [PMC free article] [PubMed] [Google Scholar]
- Avva SVSP, Hart CM. Characterization of the Drosophila BEAF-32A and BEAF-32B Insulator Proteins. PLOS ONE. 2016;11:e0162906. doi: 10.1371/journal.pone.0162906. [DOI] [PMC free article] [PubMed] [Google Scholar]
- Bateman JR, Lee AM, Wu C. Site-specific transformation of Drosophila via phiC31 integrase-mediated cassette exchange. Genetics. 2006;173:769–777. doi: 10.1534/genetics.106.056945. [DOI] [PMC free article] [PubMed] [Google Scholar]
- Batut PJ, Bing XY, Sisco Z, Raimundo J, Levo M, Levine MS. Genome organization controls transcriptional dynamics during development. Science. 2022;375:566–570. doi: 10.1126/science.abi7178. [DOI] [PMC free article] [PubMed] [Google Scholar]
- Bell AC, West AG, Felsenfeld G. Insulators and boundaries: versatile regulatory elements in the eukaryotic genome. Science. 2001;291:447–450. doi: 10.1126/science.291.5503.447. [DOI] [PubMed] [Google Scholar]
- Blanton J, Gaszner M, Schedl P. Protein:protein interactions and the pairing of boundary elements in vivo. Genes & Development. 2003;17:664–675. doi: 10.1101/gad.1052003. [DOI] [PMC free article] [PubMed] [Google Scholar]
- Bonchuk A, Denisov S, Georgiev P, Maksimenko O. Drosophila BTB/POZ domains of “ttk group” can form multimers and selectively interact with each other. Journal of Molecular Biology. 2011;412:423–436. doi: 10.1016/j.jmb.2011.07.052. [DOI] [PubMed] [Google Scholar]
- Bonchuk A, Kamalyan S, Mariasina S, Boyko K, Popov V, Maksimenko O, Georgiev P. N-terminal domain of the architectural protein CTCF has similar structural organization and ability to self-association in bilaterian organisms. Scientific Reports. 2020;10:2677. doi: 10.1038/s41598-020-59459-5. [DOI] [PMC free article] [PubMed] [Google Scholar]
- Bonchuk A, Boyko K, Fedotova A, Nikolaeva A, Lushchekina S, Khrustaleva A, Popov V, Georgiev P. Structural basis of diversity and homodimerization specificity of zinc-finger-associated domains in Drosophila. Nucleic Acids Research. 2021;49:2375–2389. doi: 10.1093/nar/gkab061. [DOI] [PMC free article] [PubMed] [Google Scholar]
- Cai HN, Shen P. Effects of cis arrangement of chromatin insulators on enhancer-blocking activity. Science. 2001;291:493–495. doi: 10.1126/science.291.5503.493. [DOI] [PubMed] [Google Scholar]
- Callan HG. The nature of lampbrush chromosomes. International Review of Cytology. 1963;15:1–34. doi: 10.1016/s0074-7696(08)61114-6. [DOI] [PubMed] [Google Scholar]
- Cavalheiro GR, Pollex T, Furlong EE. To loop or not to loop: what is the role of TADs in enhancer function and gene regulation? Current Opinion in Genetics & Development. 2021;67:119–129. doi: 10.1016/j.gde.2020.12.015. [DOI] [PubMed] [Google Scholar]
- Chen H, Levo M, Barinov L, Fujioka M, Jaynes JB, Gregor T. Dynamic interplay between enhancer-promoter topology and gene activity. Nature Genetics. 2018;50:1296–1303. doi: 10.1038/s41588-018-0175-z. [DOI] [PMC free article] [PubMed] [Google Scholar]
- Chetverina D, Aoki T, Erokhin M, Georgiev P, Schedl P. Making connections: insulators organize eukaryotic chromosomes into independent cis-regulatory networks. BioEssays. 2014;36:163–172. doi: 10.1002/bies.201300125. [DOI] [PMC free article] [PubMed] [Google Scholar]
- Chetverina D, Fujioka M, Erokhin M, Georgiev P, Jaynes JB, Schedl P. Boundaries of loop domains (insulators): Determinants of chromosome form and function in multicellular eukaryotes. BioEssays. 2017;39:0233. doi: 10.1002/bies.201600233. [DOI] [PMC free article] [PubMed] [Google Scholar]
- Collier JE, Nasmyth KA. DNA passes through cohesin’s hinge as well as its Smc3-kleisin interface. eLife. 2022;11:e80310. doi: 10.7554/eLife.80310. [DOI] [PMC free article] [PubMed] [Google Scholar]
- Cuartero S, Fresán U, Reina O, Planet E, Espinàs ML. Ibf1 and Ibf2 are novel CP190-interacting proteins required for insulator function. The EMBO Journal. 2014;33:637–647. doi: 10.1002/embj.201386001. [DOI] [PMC free article] [PubMed] [Google Scholar]
- Davidson IF, Peters JM. Genome folding through loop extrusion by SMC complexes. Nature Reviews. Molecular Cell Biology. 2021;22:445–464. doi: 10.1038/s41580-021-00349-7. [DOI] [PubMed] [Google Scholar]
- dos Santos G, Schroeder AJ, Goodman JL, Strelets VB, Crosby MA, Thurmond J, Emmert DB, Gelbart WM, FlyBase Consortium FlyBase: introduction of the Drosophila melanogaster Release 6 reference genome assembly and large-scale migration of genome annotations. Nucleic Acids Research. 2015;43:D690–D697. doi: 10.1093/nar/gku1099. [DOI] [PMC free article] [PubMed] [Google Scholar]
- Duan J, Rieder L, Colonnetta MM, Huang A, Mckenney M, Watters S, Deshpande G, Jordan W, Fawzi N, Larschan E. CLAMP and Zelda function together to promote Drosophila zygotic genome activation. eLife. 2021;10:e69937. doi: 10.7554/eLife.69937. [DOI] [PMC free article] [PubMed] [Google Scholar]
- Erceg J, AlHaj Abed J, Goloborodko A, Lajoie BR, Fudenberg G, Abdennur N, Imakaev M, McCole RB, Nguyen SC, Saylor W, Joyce EF, Senaratne TN, Hannan MA, Nir G, Dekker J, Mirny LA, Wu C-T. The genome-wide multi-layered architecture of chromosome pairing in early Drosophila embryos. Nature Communications. 2019;10:4486. doi: 10.1038/s41467-019-12211-8. [DOI] [PMC free article] [PubMed] [Google Scholar]
- Erokhin M, Davydova A, Kyrchanova O, Parshikov A, Georgiev P, Chetverina D. Insulators form gene loops by interacting with promoters in Drosophila. Development. 2011;138:4097–4106. doi: 10.1242/dev.062836. [DOI] [PubMed] [Google Scholar]
- Erokhin M, Gorbenko F, Lomaev D, Mazina MY, Mikhailova A, Garaev AK, Parshikov A, Vorobyeva NE, Georgiev P, Schedl P, Chetverina D. Boundaries potentiate polycomb response element-mediated silencing. BMC Biology. 2021;19:113. doi: 10.1186/s12915-021-01047-8. [DOI] [PMC free article] [PubMed] [Google Scholar]
- Fedotova AA, Bonchuk AN, Mogila VA, Georgiev PG. C2H2 Zinc Finger Proteins: The Largest but Poorly Explored Family of Higher Eukaryotic Transcription Factors. Acta Naturae. 2017;9:47–58. [PMC free article] [PubMed] [Google Scholar]
- Fedotova A, Aoki T, Rossier M, Mishra RK, Clendinen C, Kyrchanova O, Wolle D, Bonchuk A, Maeda RK, Mutero A, Cleard F, Mogila V, Karch F, Georgiev P, Schedl P. The BEN Domain Protein Insensitive Binds to the Fab-7 Chromatin Boundary To Establish Proper Segmental Identity in Drosophila. Genetics. 2018;210:573–585. doi: 10.1534/genetics.118.301259. [DOI] [PMC free article] [PubMed] [Google Scholar]
- Fedotova A, Clendinen C, Bonchuk A, Mogila V, Aoki T, Georgiev P, Schedl P. Functional dissection of the developmentally restricted BEN domain chromatin boundary factor Insensitive. Epigenetics & Chromatin. 2019;12:2. doi: 10.1186/s13072-018-0249-2. [DOI] [PMC free article] [PubMed] [Google Scholar]
- Fudenberg G, Imakaev M, Lu C, Goloborodko A, Abdennur N, Mirny LA. Formation of chromosomal domains by loop extrusion. Cell Reports. 2016;15:2038–2049. doi: 10.1016/j.celrep.2016.04.085. [DOI] [PMC free article] [PubMed] [Google Scholar]
- Fujioka M, Wu X, Jaynes JB. A chromatin insulator mediates transgene homing and very long-range enhancer-promoter communication. Development. 2009;136:3077–3087. doi: 10.1242/dev.036467. [DOI] [PMC free article] [PubMed] [Google Scholar]
- Fujioka M, Sun G, Jaynes JB. The Drosophila eve insulator Homie promotes eve expression and protects the adjacent gene from repression by polycomb spreading. PLOS Genetics. 2013;9:e1003883. doi: 10.1371/journal.pgen.1003883. [DOI] [PMC free article] [PubMed] [Google Scholar]
- Fujioka M, Mistry H, Schedl P, Jaynes JB. Determinants of chromosome architecture: Insulator pairing in cis and in trans. PLOS Genetics. 2016;12:e1005889. doi: 10.1371/journal.pgen.1005889. [DOI] [PMC free article] [PubMed] [Google Scholar]
- Fukaya T, Lim B, Levine M. Enhancer control of transcriptional bursting. Cell. 2016;166:358–368. doi: 10.1016/j.cell.2016.05.025. [DOI] [PMC free article] [PubMed] [Google Scholar]
- Fung JC, Marshall WF, Dernburg A, Agard DA, Sedat JW. Homologous chromosome pairing in Drosophila melanogaster proceeds through multiple independent initiations. The Journal of Cell Biology. 1998;141:5–20. doi: 10.1083/jcb.141.1.5. [DOI] [PMC free article] [PubMed] [Google Scholar]
- Gaskill MM, Gibson TJ, Larson ED, Harrison MM. GAF is essential for zygotic genome activation and chromatin accessibility in the early Drosophila embryo. eLife. 2021;10:e66668. doi: 10.7554/eLife.66668. [DOI] [PMC free article] [PubMed] [Google Scholar]
- Ghosh RP, Meyer BJ. Spatial organization of chromatin: Emergence of chromatin structure during development. Annual Review of Cell and Developmental Biology. 2021;37:199–232. doi: 10.1146/annurev-cellbio-032321-035734. [DOI] [PMC free article] [PubMed] [Google Scholar]
- Gligoris TG, Scheinost JC, Bürmann F, Petela N, Chan KL, Uluocak P, Beckouët F, Gruber S, Nasmyth K, Löwe J. Closing the cohesin ring: structure and function of its Smc3-kleisin interface. Science. 2014;346:963–967. doi: 10.1126/science.1256917. [DOI] [PMC free article] [PubMed] [Google Scholar]
- Gohl D, Aoki T, Blanton J, Shanower G, Kappes G, Schedl P. Mechanism of chromosomal boundary action: roadblock, sink, or loop? Genetics. 2011;187:731–748. doi: 10.1534/genetics.110.123752. [DOI] [PMC free article] [PubMed] [Google Scholar]
- Goloborodko A. Pairtools. 8c41a26GitHub. 2024 https://github.com/open2c/pairtools
- Goloborodko A, Venev S, Abdennur N, Brandão HB, Fudenberg G. Pairsamtools. d3cb1e7GitHub. 2024 https://github.com/mirnylab/pairsamtools
- Gramates LS, Agapite J, Attrill H, Calvi BR, Crosby MA, Dos Santos G, Goodman JL, Goutte-Gattat D, Jenkins VK, Kaufman T, Larkin A, Matthews BB, Millburn G, Strelets VB, the FlyBase Consortium FlyBase: A guided tour of highlighted features. Genetics. 2022;220:iyac035. doi: 10.1093/genetics/iyac035. [DOI] [PMC free article] [PubMed] [Google Scholar]
- Guo Y, Monahan K, Wu H, Gertz J, Varley KE, Li W, Myers RM, Maniatis T, Wu Q. CTCF/cohesin-mediated DNA looping is required for protocadherin α promoter choice. PNAS. 2012;109:21081–21086. doi: 10.1073/pnas.1219280110. [DOI] [PMC free article] [PubMed] [Google Scholar]
- Guo Y, Xu Q, Canzio D, Shou J, Li J, Gorkin DU, Jung I, Wu H, Zhai Y, Tang Y, Lu Y, Wu Y, Jia Z, Li W, Zhang MQ, Ren B, Krainer AR, Maniatis T, Wu Q. CRISPR Inversion of CTCF Sites Alters Genome Topology and Enhancer/Promoter Function. Cell. 2015;162:900–910. doi: 10.1016/j.cell.2015.07.038. [DOI] [PMC free article] [PubMed] [Google Scholar]
- Hart CM, Zhao K, Laemmli UK. The scs’ boundary element: characterization of boundary element-associated factors. Molecular and Cellular Biology. 1997;17:999–1009. doi: 10.1128/MCB.17.2.999. [DOI] [PMC free article] [PubMed] [Google Scholar]
- Heger P, George R, Wiehe T. Successive gain of insulator proteins in arthropod evolution. Evolution; International Journal of Organic Evolution. 2013;67:2945–2956. doi: 10.1111/evo.12155. [DOI] [PMC free article] [PubMed] [Google Scholar]
- Heger P, Wiehe T. New tools in the box: an evolutionary synopsis of chromatin insulators. Trends in Genetics. 2014;30:161–171. doi: 10.1016/j.tig.2014.03.004. [DOI] [PubMed] [Google Scholar]
- Hsieh T-HS, Cattoglio C, Slobodyanyuk E, Hansen AS, Rando OJ, Tjian R, Darzacq X. Resolving the 3D landscape of transcription-linked mammalian chromatin folding. Molecular Cell. 2020;78:539–553. doi: 10.1016/j.molcel.2020.03.002. [DOI] [PMC free article] [PubMed] [Google Scholar]
- Jerković I, Szabo Q, Bantignies F, Cavalli G. Higher-order chromosomal structures mediate genome function. Journal of Molecular Biology. 2020;432:676–681. doi: 10.1016/j.jmb.2019.10.014. [DOI] [PubMed] [Google Scholar]
- Ke W, Fujioka M, Schedl P, Jaynes JB. Stem-loop and circle-loop TADs generated by directional pairing of boundary elements have distinct physical and regulatory properties. eLife. 2024;20:e94114. doi: 10.7554/eLife.94114. [DOI] [PMC free article] [PubMed] [Google Scholar]
- Kerpedjiev P, Abdennur N, Lekschas F, McCallum C, Dinkla K, Strobelt H, Luber JM, Ouellette SB, Azhir A, Kumar N, Hwang J, Lee S, Alver BH, Pfister H, Mirny LA, Park PJ, Gehlenborg N. HiGlass: web-based visual exploration and analysis of genome interaction maps. Genome Biology. 2018;19:125. doi: 10.1186/s13059-018-1486-1. [DOI] [PMC free article] [PubMed] [Google Scholar]
- Krietenstein N, Abraham S, Venev SV, Abdennur N, Gibcus J, Hsieh T-HS, Parsi KM, Yang L, Maehr R, Mirny LA, Dekker J, Rando OJ. Ultrastructural details of mammalian chromosome architecture. Molecular Cell. 2020;78:554–565. doi: 10.1016/j.molcel.2020.03.003. [DOI] [PMC free article] [PubMed] [Google Scholar]
- Kruse K, Hug CB, Vaquerizas JM. FAN-C: A feature-rich framework for the analysis and visualisation of chromosome conformation capture data. Genome Biology. 2020;21:303. doi: 10.1186/s13059-020-02215-9. [DOI] [PMC free article] [PubMed] [Google Scholar]
- Kyrchanova O, Toshchakov S, Parshikov A, Georgiev P. Study of the functional interaction between Mcp insulators from the Drosophila bithorax complex: effects of insulator pairing on enhancer-promoter communication. Molecular and Cellular Biology. 2007;27:3035–3043. doi: 10.1128/MCB.02203-06. [DOI] [PMC free article] [PubMed] [Google Scholar]
- Kyrchanova O, Chetverina D, Maksimenko O, Kullyev A, Georgiev P. Orientation-dependent interaction between Drosophila insulators is a property of this class of regulatory elements. Nucleic Acids Research. 2008a;36:7019–7028. doi: 10.1093/nar/gkn781. [DOI] [PMC free article] [PubMed] [Google Scholar]
- Kyrchanova O, Toshchakov S, Podstreshnaya Y, Parshikov A, Georgiev P. Functional interaction between the Fab-7 and Fab-8 boundaries and the upstream promoter region in the Drosophila Abd-B gene. Molecular and Cellular Biology. 2008b;28:4188–4195. doi: 10.1128/MCB.00229-08. [DOI] [PMC free article] [PubMed] [Google Scholar]
- Kyrchanova O, Ivlieva T, Toshchakov S, Parshikov A, Maksimenko O, Georgiev P. Selective interactions of boundaries with upstream region of Abd-B promoter in Drosophila bithorax complex and role of dCTCF in this process. Nucleic Acids Research. 2011;39:3042–3052. doi: 10.1093/nar/gkq1248. [DOI] [PMC free article] [PubMed] [Google Scholar]
- Kyrchanova O, Kurbidaeva A, Sabirov M, Postika N, Wolle D, Aoki T, Maksimenko O, Mogila V, Schedl P, Georgiev P. The bithorax complex iab-7 Polycomb response element has a novel role in the functioning of the Fab-7 chromatin boundary. PLOS Genetics. 2018;14:e1007442. doi: 10.1371/journal.pgen.1007442. [DOI] [PMC free article] [PubMed] [Google Scholar]
- Kyrchanova O, Sabirov M, Mogila V, Kurbidaeva A, Postika N, Maksimenko O, Schedl P, Georgiev P. Complete reconstitution of bypass and blocking functions in a minimal artificial Fab-7 insulator from Drosophila bithorax complex. PNAS. 2019a;116:13462–13467. doi: 10.1073/pnas.1907190116. [DOI] [PMC free article] [PubMed] [Google Scholar]
- Kyrchanova O, Wolle D, Sabirov M, Kurbidaeva A, Aoki T, Maksimenko O, Kyrchanova M, Georgiev P, Schedl P. Distinct Elements Confer the Blocking and Bypass Functions of the Bithorax Fab-8 Boundary. Genetics. 2019b;213:865–876. doi: 10.1534/genetics.119.302694. [DOI] [PMC free article] [PubMed] [Google Scholar]
- Kyrchanova O, Ibragimov A, Postika N, Georgiev P, Schedl P. Boundary bypass activity in the abdominal-B region of the Drosophila bithorax complex is position dependent and regulated. Open Biology. 2023;13:230035. doi: 10.1098/rsob.230035. [DOI] [PMC free article] [PubMed] [Google Scholar]
- Lee S. Pairix. 94d0107GitHub. 2024 https://github.com/4dn-dcic/pairix
- Levo M, Raimundo J, Bing XY, Sisco Z, Batut PJ, Ryabichko S, Gregor T, Levine MS. Transcriptional coupling of distant regulatory genes in living embryos. Nature. 2022;605:754–760. doi: 10.1038/s41586-022-04680-7. [DOI] [PMC free article] [PubMed] [Google Scholar]
- Li H, Durbin R. Fast and accurate short read alignment with Burrows-Wheeler transform. Bioinformatics. 2009;25:1754–1760. doi: 10.1093/bioinformatics/btp324. [DOI] [PMC free article] [PubMed] [Google Scholar]
- Li H-B, Müller M, Bahechar IA, Kyrchanova O, Ohno K, Georgiev P, Pirrotta V. Insulators, not Polycomb response elements, are required for long-range interactions between Polycomb targets in Drosophila melanogaster. Molecular and Cellular Biology. 2011;31:616–625. doi: 10.1128/MCB.00849-10. [DOI] [PMC free article] [PubMed] [Google Scholar]
- Li L, Lyu X, Hou C, Takenaka N, Nguyen HQ, Ong C-T, Cubeñas-Potts C, Hu M, Lei EP, Bosco G, Qin ZS, Corces VG. Widespread rearrangement of 3D chromatin organization underlies polycomb-mediated stress-induced silencing. Molecular Cell. 2015;58:216–231. doi: 10.1016/j.molcel.2015.02.023. [DOI] [PMC free article] [PubMed] [Google Scholar]
- Li X, Tang X, Bing X, Catalano C, Li T, Dolsten G, Wu C, Levine M. GAGA-associated factor fosters loop formation in the Drosophila genome. Molecular Cell. 2023;83:1519–1526. doi: 10.1016/j.molcel.2023.03.011. [DOI] [PMC free article] [PubMed] [Google Scholar]
- Lim B, Heist T, Levine M, Fukaya T. Visualization of Transvection in Living Drosophila Embryos. Molecular Cell. 2018;70:287–296. doi: 10.1016/j.molcel.2018.02.029. [DOI] [PMC free article] [PubMed] [Google Scholar]
- Little SC, Gregor T. Single mRNA Molecule Detection in Drosophila. Methods in Molecular Biology. 2018;1649:127–142. doi: 10.1007/978-1-4939-7213-5_8. [DOI] [PMC free article] [PubMed] [Google Scholar]
- Matthews NE, White R. Chromatin architecture in the fly: living without CTCF/Cohesin loop extrusion? BioEssays. 2019;41:e1900048. doi: 10.1002/bies.201900048. [DOI] [PubMed] [Google Scholar]
- Mirny L, Dekker J. Mechanisms of chromosome folding and nuclear organization: Their interplay and open questions. Cold Spring Harbor Perspectives in Biology. 2022;14:a040147. doi: 10.1101/cshperspect.a040147. [DOI] [PMC free article] [PubMed] [Google Scholar]
- Mohana G, Dorier J, Li X, Mouginot M, Smith RC, Malek H, Leleu M, Rodriguez D, Khadka J, Rosa P, Cousin P, Iseli C, Restrepo S, Guex N, McCabe BD, Jankowski A, Levine MS, Gambetta MC. Chromosome-level organization of the regulatory genome in the Drosophila nervous system. Cell. 2023;186:3826–3844. doi: 10.1016/j.cell.2023.07.008. [DOI] [PMC free article] [PubMed] [Google Scholar]
- Muller M, Hagstrom K, Gyurkovics H, Pirrotta V, Schedl P. The mcp element from the Drosophila melanogaster bithorax complex mediates long-distance regulatory interactions. Genetics. 1999;153:1333–1356. doi: 10.1093/genetics/153.3.1333. [DOI] [PMC free article] [PubMed] [Google Scholar]
- Muravyova E, Golovnin A, Gracheva E, Parshikov A, Belenkaya T, Pirrotta V, Georgiev P. Loss of insulator activity by paired Su(Hw) chromatin insulators. Science. 2001;291:495–498. doi: 10.1126/science.291.5503.495. [DOI] [PubMed] [Google Scholar]
- Nora EP, Caccianini L, Fudenberg G, So K, Kameswaran V, Nagle A, Uebersohn A, Hajj B, Saux AL, Coulon A, Mirny LA, Pollard KS, Dahan M, Bruneau BG. Molecular basis of CTCF binding polarity in genome folding. Nature Communications. 2020;11:5612. doi: 10.1038/s41467-020-19283-x. [DOI] [PMC free article] [PubMed] [Google Scholar]
- Nuebler J, Fudenberg G, Imakaev M, Abdennur N, Mirny LA. Chromatin organization by an interplay of loop extrusion and compartmental segregation. PNAS. 2018;115:E6697–E6706. doi: 10.1073/pnas.1717730115. [DOI] [PMC free article] [PubMed] [Google Scholar]
- Perea-Resa C, Wattendorf L, Marzouk S, Blower MD. Cohesin: behind dynamic genome topology and gene expression reprogramming. Trends in Cell Biology. 2021;31:760–773. doi: 10.1016/j.tcb.2021.03.005. [DOI] [PMC free article] [PubMed] [Google Scholar]
- Rowley MJ, Corces VG. Organizational principles of 3D genome architecture. Nature Reviews. Genetics. 2018;19:789–800. doi: 10.1038/s41576-018-0060-8. [DOI] [PMC free article] [PubMed] [Google Scholar]
- Sanborn AL, Rao SSP, Huang S-C, Durand NC, Huntley MH, Jewett AI, Bochkov ID, Chinnappan D, Cutkosky A, Li J, Geeting KP, Gnirke A, Melnikov A, McKenna D, Stamenova EK, Lander ES, Aiden EL. Chromatin extrusion explains key features of loop and domain formation in wild-type and engineered genomes. PNAS. 2015;112:E6456–E6465. doi: 10.1073/pnas.1518552112. [DOI] [PMC free article] [PubMed] [Google Scholar]
- Schindelin J, Arganda-Carreras I, Frise E, Kaynig V, Longair M, Pietzsch T, Preibisch S, Rueden C, Saalfeld S, Schmid B, Tinevez J-Y, White DJ, Hartenstein V, Eliceiri K, Tomancak P, Cardona A. Fiji: an open-source platform for biological-image analysis. Nature Methods. 2012;9:676–682. doi: 10.1038/nmeth.2019. [DOI] [PMC free article] [PubMed] [Google Scholar]
- Schoborg TA, Labrador M. The phylogenetic distribution of non-CTCF insulator proteins is limited to insects and reveals that BEAF-32 is Drosophila lineage specific. Journal of Molecular Evolution. 2010;70:74–84. doi: 10.1007/s00239-009-9310-x. [DOI] [PubMed] [Google Scholar]
- Sigrist CJ, Pirrotta V. Chromatin insulator elements block the silencing of a target gene by the Drosophila polycomb response element (PRE) but allow trans interactions between PREs on different chromosomes. Genetics. 1997;147:209–221. doi: 10.1093/genetics/147.1.209. [DOI] [PMC free article] [PubMed] [Google Scholar]
- Sun Y, Nien CY, Chen K, Liu HY, Johnston J, Zeitlinger J, Rushlow C. Zelda overcomes the high intrinsic nucleosome barrier at enhancers during Drosophila zygotic genome activation. Genome Research. 2015;25:1703–1714. doi: 10.1101/gr.192542.115. [DOI] [PMC free article] [PubMed] [Google Scholar]
- Tan L, Shi J, Moghadami S, Parasar B, Wright CP, Seo Y, Vallejo K, Cobos I, Duncan L, Chen R, Deisseroth K. Lifelong restructuring of 3D genome architecture in cerebellar granule cells. Science. 2023;381:1112–1119. doi: 10.1126/science.adh3253. [DOI] [PMC free article] [PubMed] [Google Scholar]
- Trcek T, Lionnet T, Shroff H, Lehmann R. mRNA quantification using single-molecule FISH in Drosophila embryos. Nature Protocols. 2017;12:1326–1348. doi: 10.1038/nprot.2017.030. [DOI] [PMC free article] [PubMed] [Google Scholar]
- Ueberschär M, Wang H, Zhang C, Kondo S, Aoki T, Schedl P, Lai EC, Wen J, Dai Q. BEN-solo factors partition active chromatin to ensure proper gene activation in Drosophila. Nature Communications. 2019;10:5700. doi: 10.1038/s41467-019-13558-8. [DOI] [PMC free article] [PubMed] [Google Scholar]
- Vazquez J, Farkas G, Gaszner M, Udvardy A, Muller M, Hagstrom K, Gyurkovics H, Sipos L, Gausz J, Galloni M. Genetic and molecular analysis of chromatin domains. Cold Spring Harbor Symposia on Quantitative Biology. 1993;58:45–54. doi: 10.1101/sqb.1993.058.01.008. [DOI] [PubMed] [Google Scholar]
- Vazquez J, Müller M, Pirrotta V, Sedat JW. The Mcp element mediates stable long-range chromosome-chromosome interactions in Drosophila. Molecular Biology of the Cell. 2006;17:2158–2165. doi: 10.1091/mbc.e06-01-0049. [DOI] [PMC free article] [PubMed] [Google Scholar]
- Yokoshi M, Segawa K, Fukaya T. Visualizing the role of boundary elements in enhancer-promoter communication. Molecular Cell. 2020;78:224–235. doi: 10.1016/j.molcel.2020.02.007. [DOI] [PubMed] [Google Scholar]
- Zhimulev IF, Pokholkova GV, Bgatov AV, Semeshin VF, Umbetova GH, Belyaeva ES. Genetic interpretation of polytene chromosomes banding pattern. Molecular Biology Reports. 1983;9:19–23. doi: 10.1007/BF00777469. [DOI] [PubMed] [Google Scholar]
- Zhimulev IF, Belyaeva ES. Chromomeric organization of polytene chromosomes. Genetica. 1991;85:65–72. doi: 10.1007/BF00056107. [DOI] [PubMed] [Google Scholar]
- Zolotarev N, Fedotova A, Kyrchanova O, Bonchuk A, Penin AA, Lando AS, Eliseeva IA, Kulakovskiy IV, Maksimenko O, Georgiev P. Architectural proteins Pita, Zw5,and ZIPIC contain homodimerization domain and support specific long-range interactions in Drosophila. Nucleic Acids Research. 2016;44:7228–7241. doi: 10.1093/nar/gkw371. [DOI] [PMC free article] [PubMed] [Google Scholar]