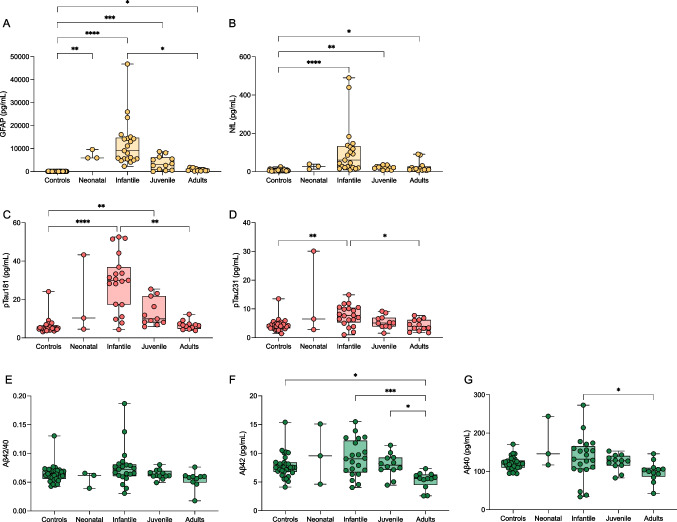
Fig. 1.
Box and whisker plots demonstrating the concentrations of blood GFAP (A), NfL (B), pTau181 (C), pTau231 (D), Aβ42/40 (E), Aβ42 (F), and Aβ40 (G) in controls and AxD patients separated by age of onset. The age of onset classification boundaries are as in Jany et al. (2015) with the addition of the neonatal form (years): neonatal (0–0.08), infantile (0.08–2), juvenile (> 2–13), adult (> 13). *P < 0.05, **P < 0.01, ***P < 0.001, ****P < 0.0001

