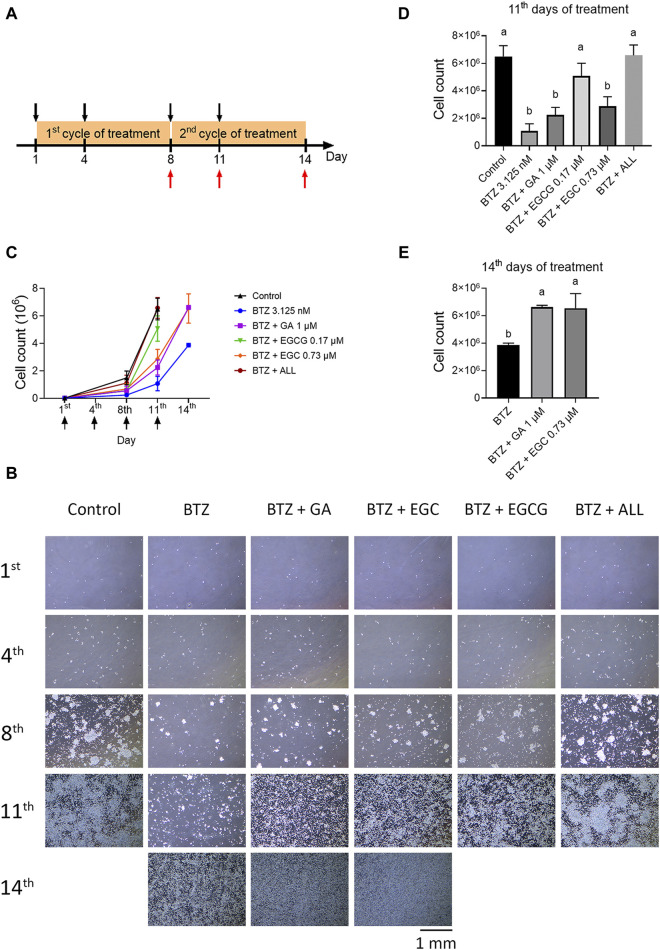
FIGURE 5.
The combination of GA, EGC, and EGCG at physiological concentrations completely reverse the effect of BTZ. (A) Treatment Protocol: RPMI 8226 cells were cultured in 10 cm dishes (2.5 × 10⁴ cells/dish) and treated with BTZ (3.125 nM), along with gallic acid (GA, 1 µM), (−)‐epigallocatechin (EGC, 0.73 µM), and epigallocatechin gallate (EGCG, 0.17 µM), bringing the total volume to 10 mL, for a period of 3 days. On day 4, an additional 5 mL of the drug-containing medium was added to the dishes, followed by a continued incubation for 4 days. On day 8, the medium was refreshed with 10 mL of the drug-containing medium. Subsequently, on day 11, another 5 mL of the drug-containing medium was introduced and incubation was continued to the end of experiment. Cell counts were conducted on days 8, 11, and 14. Treatment days and cell count days are indicated by black and red arrows, respectively. (B) Phase-contrast microscopic images of cell density on the 1st, 4th, 8th, 11th, and 14th day. Pictures were taken at ×4 magnification. (C) Growth curve of all groups. The cell numbers were determined using trypan blue. The treatment day was indicated by the black arrow. (D,E) Total cell counts on the 11th and 14th day, with statistical analysis. Data represent the mean ± SD (n = 3). Statistical significance: p < 0.05 (one-way ANOVA, Tukey’s multiple comparisons test).

