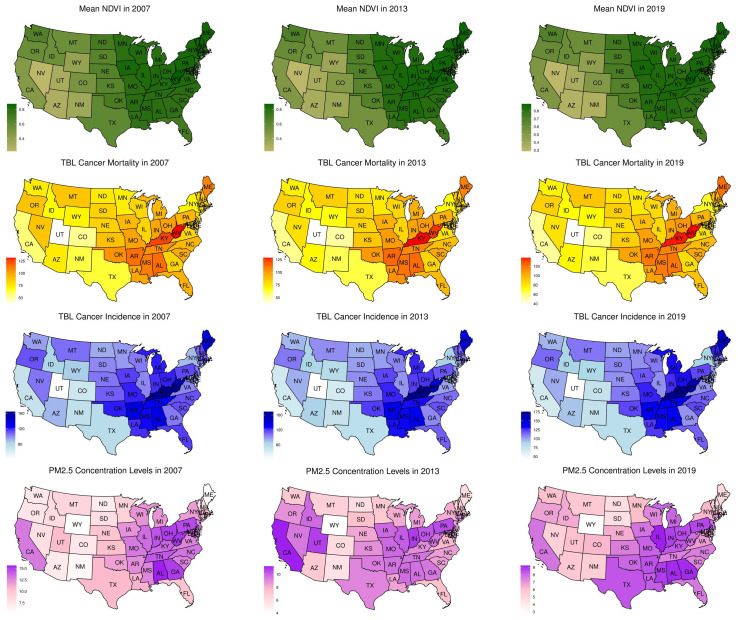
Figure 1.
Distribution of mean NDVI, TBL cancer mortality, TBL cancer incidence, and mean PM2.5 concentration levels in ages over 20 years in the U.S. in 2007, 2013, and 2019. The normalized differential vegetation index (NDVI) values for 2007 (left), 2013 (middle), and 2019 (right), are shown on a spectrum of light green (least value) to dark green (highest value). Mean NDVI values of 0 to 0.2 are categorized as low, >0.2 to 4.0 as moderate, and >0.4 as high levels of greenspaces. Rates of TBL cancer incidence and mortality in ages over 55 years are shown on a spectrum of white (least value) to red (highest value) and dark blue (highest value).

