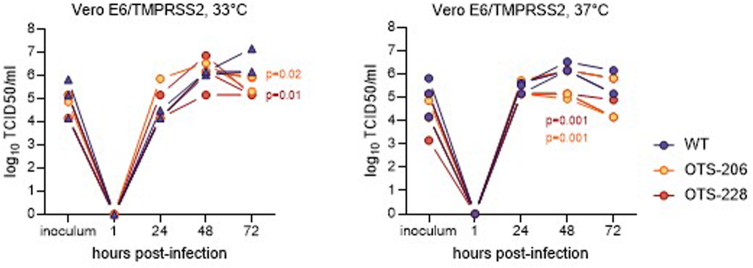
Extended Data Fig. 7. OTS-228 shows replication kinetics comparable to WT and OTS-206 in VeroE6/TMPRSS2 cells.
Vero E6/TMPRSS2 cells were infected with 0.1 MOI of the indicated viruses and incubated at 37 °C for 1 h. After 1 h, supernatant was discarded and the cells were washed 3 times with PBS, and the third wash was kept for analysis. Following the addition of new sera on the cells, they were incubated at 37 °C. Samples were collected on designated time points post-infection. Infectious particle titers were assessed by TCID50 assays on VeroE6/TMPRSS2 cells. Each line in the graphs shows one replicate of samples. Statistical significances in the titer differences of OTS viruses vs WT on given times were determined using two-sided two-way ANOVA and p-values were adjusted using Tukey’s multiple-comparison test; *P<0.05, **P<0.01, ***P<0.001, ****P<0.0001.

