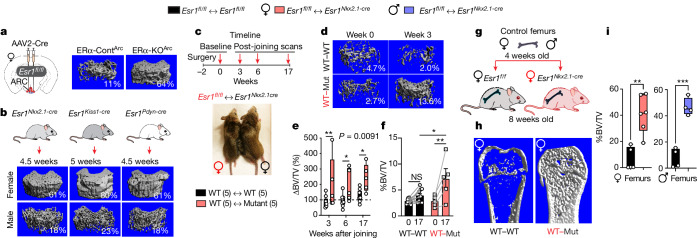
Fig. 1. A brain-dependent circulatory factor builds bones in mice.
a,b, Viral and genetic mouse models. a, Left, schematic of the stereotaxic deletion of ERα in the ARC using an AAV2-Cre vector. Right, representative µCT scans of the distal femur from females injected with AAV2 control virus (ERα-ContARC) and of a ERα-knockoutARC (ERα-KOARC) female, as previously reported2. %BV/TV values are indicated. b, µCT images obtained from Esr1Nkx2.1-cre, Esr1Kiss-cre and Esr1Prodynorphin-cre (Esr1Pdyn-cre) 4.5–5-week-old mice with %BV/TV values indicated in the lower right-hand corner. c–f, Parabiosis models. c, Timeline of in vivo µCT imaging after surgical pairing of Esr1fl/fl (WT) and Esr1Nkx2.1-cre (mutant) female mice. d, Representative in vivo µCT imaging of distal femurs at baseline (week 0) and 3 weeks later (week 3) with %BV/TV values indicated. e, Per cent change in %BV/TV at weeks 3, 6 and 17 compared with week 0 (biological sample sizes used (N) = 5). f, Absolute %BV/TV values for Esr1fl/fl females in WT–WT and WT–Mut pairs, showing values for each animal at baseline (0) and 17 weeks later (17). g–i, Bone transplants. g, Schematic of WT female and male femur transplants into Esr1fl/fl (WT) and Esr1Nkx2.1-cre (mutant) female mice for a duration of 6 weeks. h, Representative µCT images of control femurs transplanted WT–WT and WT–Mut females. i, Fractional BV (%BV/TV) of excised control femurs transplanted into Esr1fl/fl females (black bars) or female (red bar) or male (blue bar) bones transplanted into Esr1Nkx2.1-cre females (N = 4–6). Two-way analysis of variance (ANOVA) in e with repeated measures (Šidák’s multiple-comparisons test). One-way ANOVA in f (Tukey’s multiple-comparisons test). Unpaired Student’s t-test, two-tailed in i. *P < 0.05, **P < 0.01, ***P < 0.001, NS, not significant. Error bars ± s.e.m. Graphic in b was adapted from BioRender (https://www.biorender.com). Graphic in g was adapted from Mind the Graph (https://mindthegraph.com) under a Creative Commons licence CC BY-SA 4.0.

