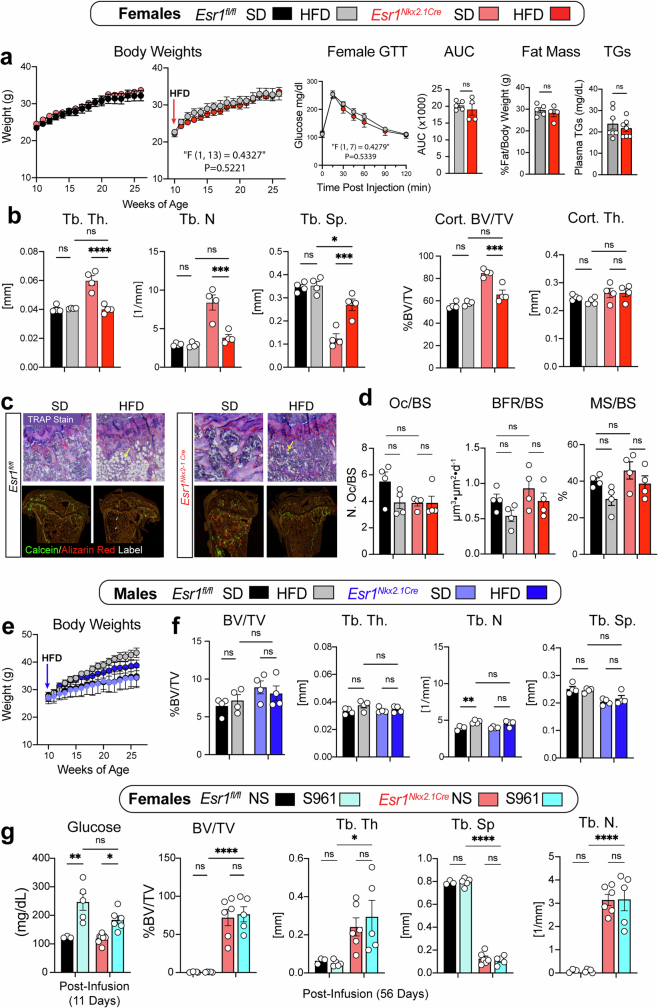
Extended Data Fig. 6. Dietary Challenge Degrades Bone Only in Mutant Females Without Altering Other Metabolic Parameters.
a, XY plot of body weights versus age for Esr1fl/fl and Esr1Nkx2.1-Cre age-matched female littermates maintained on standard breeder chow (SD) or high-fat diet (HFD) for 17 weeks starting at 10 weeks of age (N ≥ 4 per group). Blood glucose levels after GTT (i.p.), area under the curve (AUC), fat mass by DEXA fed HFD (fed for 12 weeks), and serum triglycerides (fed for 17 weeks) plotted for control and mutant females, legend on top. b, Trabecular and cortical bone parameters obtained after µCT scans for four experimental female cohorts, note that fractional bone volume for cortical bone is regraphed from main Fig. 3a. c, Representative images of sections of TRAP-stained and double-labeled with Calcein green (green) and Alizarin red (red) femurs for Esr1fl/fl and Esr1Nkx2.1-Cre cohorts. d, Dynamic histomorphometry obtained from tibias for four different experimental cohorts: osteoclasts per bone surface (Oc/BS), bone formation rate/bone surface (BFR/BS), and mineralized surface/bone surface (MS/BS), N = 4 per group. e, XY plot of body weights versus age for Esr1fl/fl and Esr1Nkx2.1-Cre age-matched male experimental cohorts, (N = 4 per group). f, Trabecular and cortical bone parameters obtained by µCT imaging for four male experimental cohorts. Legend on top. g, Blood glucose and structural bone parameters obtained by µCT imaging for Esr1fl/fl and Esr1Nkx2.1-Cre female cohorts treated with vehicle (N = 3, 6) or S961 (N = 5, 5) delivered by implanted osmotic pumps at 17.5 nM/week over a period of 8 weeks (N = 5-6 per group). Two-way ANOVA for repeated measures for panels in a and e (BW curve and GTT), respectively (Šidák’s multiple-comparisons test). One-way ANOVA for panels b, d, f, and g (Šidák’s multiple-comparisons test), Unpaired Student’s T-test 2-tailed for three right-hand panels in a. *p < 0.05, **p < 0.01, ***p < 0.001, ***p < 0.0001, ns = not significant. Error Bars ± SEM.

