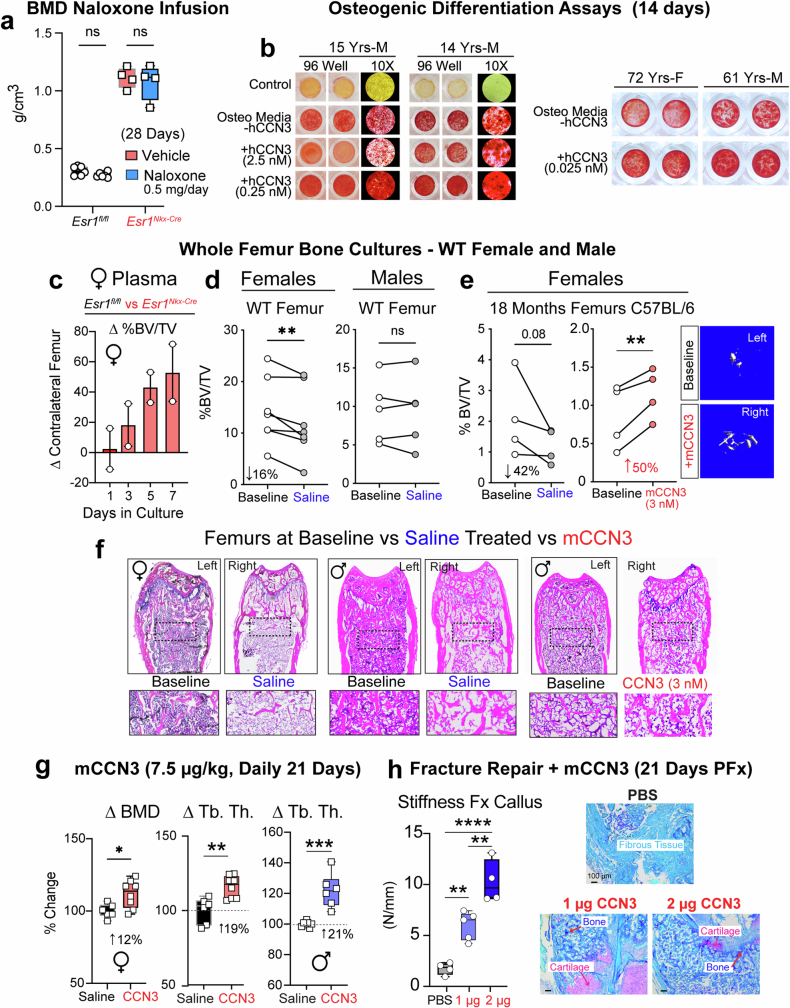
Extended Data Fig. 8. CCN3 Increases Osteogenesis in Human ocSSCs and Bone Mass in Vitro, in Vivo and in Fracture Repair.
a, Effects of chronic infusion of Naloxone over 28 days with fractional bone volume plotted for control Esr1fl/fl and mutant Esr1Nkx2.1-Cre age-matched females. The ages of female mice at the beginning of treatment were 10–12 weeks of age, which was delivered via an implanted mini-osmotic pump (0.5 mg/24 hrs) over 28 days. Legend in bar graph (N = 4 per group). b, Representative images of duplicate wells of Alizarin staining in Control media, osteogenic media minus or plus different doses of human CCN3 with magnified images of one well in far-right images of each panel. Representative images of duplicate wells of Alizarin staining in culture wells with osteogenic defined media minus or plus human CCN3. Some images from panels c and d are duplicated from Main Fig. 4a,c. c, Bar plots of change in fractional bone volume from whole femurs harvested from control females and then cultured with isolated plasma from Esr1fl/fl and Esr1Nkx2.1-Cre age-matched female littermates. Plasma (15 µl) was added daily for 1–7 days of culture as described in the Methods Section. d, Plots of fractional bone volume were determined after culturing the right femur (females) or right femur (males) in media treated with 0.9 % NS (Saline). Baseline values were obtained for freshly isolated left femur from the same mouse and immediately fixed in 4% PFA for analysis without culturing (Baseline). e. Plots of fractional bone volume were determined after culturing the right femur from 18-month-old C57BL/6 female mice in media treated with 0.9 % NS (Saline) or 3 nM mCCN3 compared to baseline. f, Representative images of H&E stained sections of the contralateral left and right femurs from the same female and male mouse at Baseline, Saline, or after treatment with mCCN3. g, Box and whiskers plots of bone parameters after saline (black) or mCCN3 (red) daily treatments of control females. h. Stiffness of callus 21 days post-fracture with images from Modified Periodic Acid‐Schiff (PAS) staining shown for callus region. One Way ANOVA for panels a and h (Tukey’s multiple-comparisons test). Paired Student’s T-test 1-tailed for panels d and e. Unpaired Student’s T-test 2-tailed for panel g. *p < 0.05, **p < 0.01, ns = not significant. Error Bars ± SEM. *p < 0.05, ***p < 0.001, ****p < 0.0001, ns = not significant. Error Bars ± SEM.

