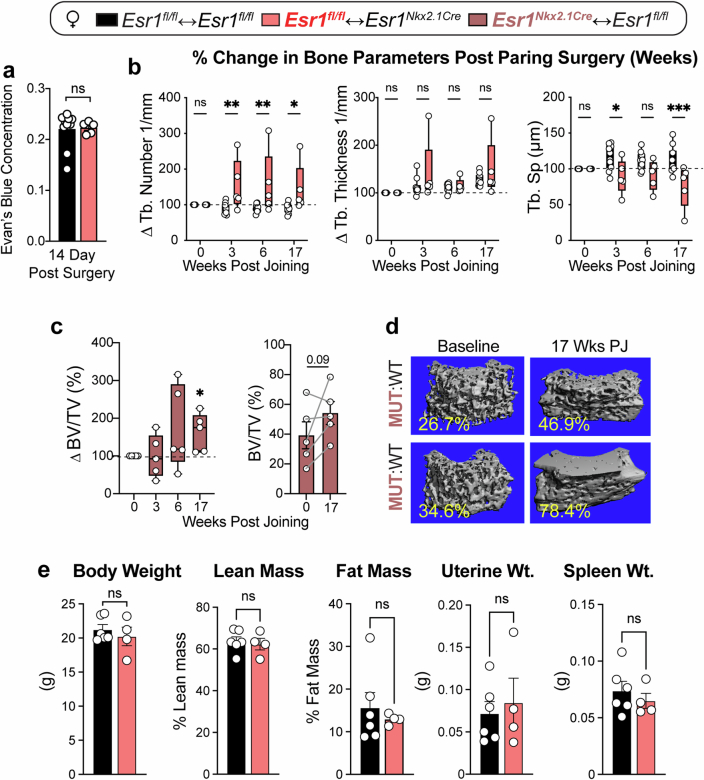
Extended Data Fig. 2. Increases in Trabecular Bone in WT:MUT and MUT:WT Parabiosis Without Weight Changes in Whole Body or Other Tissues.
a, Bar graph of Evan’s Blue concentration in blood injected into Control or Mutant female mice 14 days post-surgery to assess pairing. b, Box and whisker plots of percent changes in structural bone parameters of the Esr1fl/fl distal femur after WT:MUT pairing for the time indicated as determined by in vivo µCT imaging. c, Per cent change (left panel) and fractional bone volume (%BV/TV. right panel) in Esr1Nkx2.1Cre femurs (N = 5) in MUT:WT parabionts, as determined by in vivo µCT scans. d, Representative µCT images of Esr1Nkx2.1Cre distal femur from two different MUT:WT pairings. Legend is shown on top. Unpaired Student T-Test 2-tailed for panel a. e, Body weights and other tissue measurements obtained 17 weeks post-joining after euthanasia (N = 6, 4). Two- and One-Way ANOVA for repeated measures for panels in b and c (left), respectively (Šidák’s multiple-comparisons test). Ratio Paired Student T-Test for panels a, c (right) and e. *p < 0.05, **p < 0.01, ***p < 0.001, ns = not significant. Error Bars ± SEM.

