
Extended Data Fig. 3. Higher Bone Mass of Wild-type Femurs Transplanted into Mutant Esr1Nkx2.1-Cre Females.
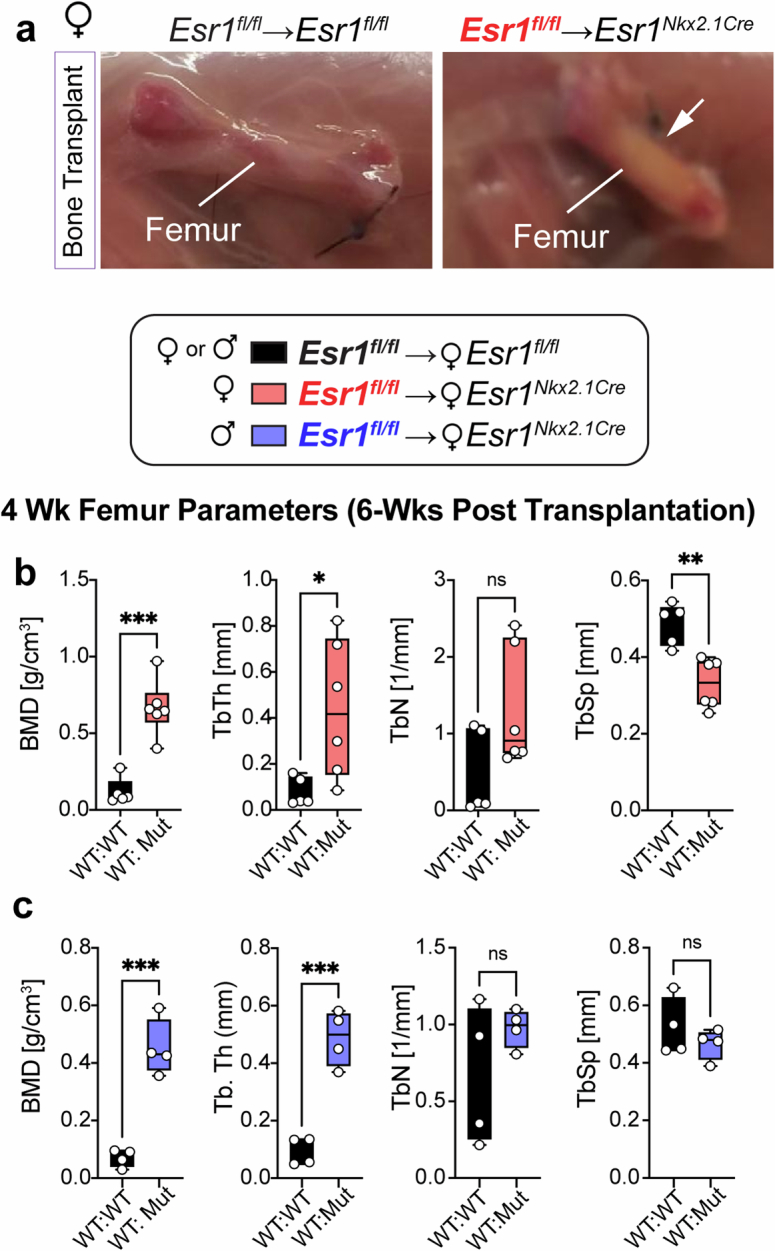
a, Images of wild-type female bones 6-weeks post-implantation into control or mutant females. b, Box and whisker plots of µCT structural parameters of wild-type female femurs into Esr1fl/fl (black) or Esr1Nkx2.1-Cre (red, N = 5, 6) females 6-weeks post-implantation. c, Box and whisker plots of µCT structural parameters of wild-type male bones into Esr1fl/fl (black) or Esr1Nkx2.1-Cre (blue, N = 4, 4) females 6-weeks post-implantation. Unpaired Student T-Test 2 tailed for panels in b and c. *p < 0.05, **p < 0.01, ***p < 0.001, ns = not significant. Legends to plots on top.