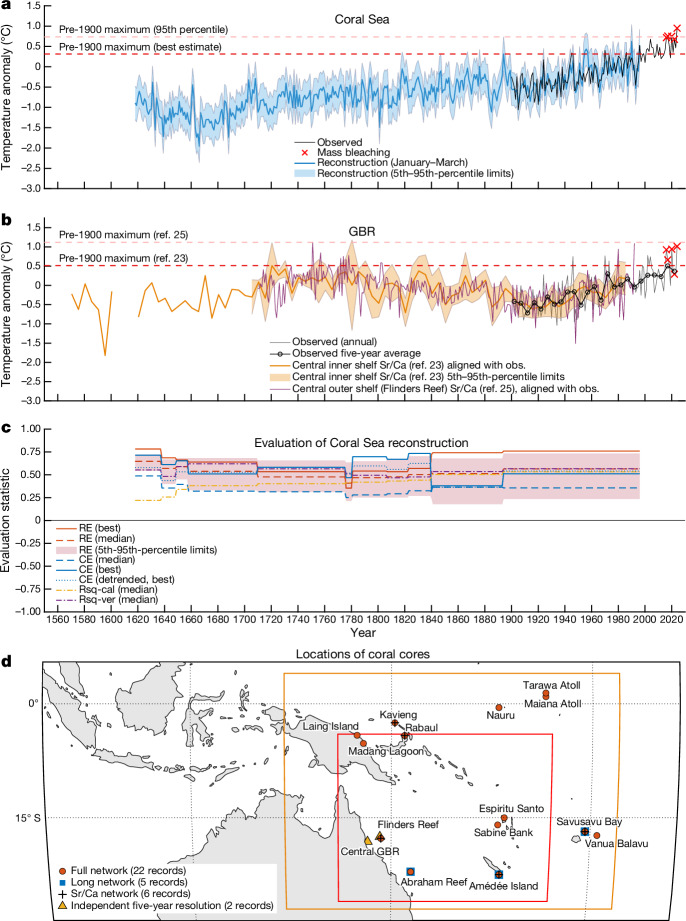
Fig. 2. Multi-century reconstruction of January–March SSTAs.
a, Reconstructed and observed mean January–March SSTAs in the Coral Sea for 1618–2024 relative to 1961–90. Dark blue, highest skill (maximum coefficient of efficiency) reconstruction with the full proxy network; light blue, 5th–95th-percentile reconstruction uncertainty; black, observed (ERSSTv5) data. Red crosses indicate the five recent mass bleaching events. Dashed lines indicate the best estimate (highest skill, red) and 95th-percentile (pink) uncertainty bound for the maximum pre-1900 January–March SSTA. b, Central GBR SSTA for the inner shelf23 in thick orange and outer shelf25 (Flinders Reef) in thin orange lines; these series are aligned here (see Methods) with modern observations of mean GBR SSTAs for January–March relative to 1961–90. Observed data are shown at annual (grey line) and five-year (black line with open circles, plotted at the centre of each five-year period and temporally aligned with the five-year coral series23) resolution. Dashed lines indicate best-estimate pre-1900 January–March maxima for refs. 23 (red) and 25 (pink). Orange shading indicates 5th–95th-percentile uncertainty bounds. Red crosses indicate the five recent mass bleaching events. c, Evaluation metrics for the Coral Sea reconstruction (Supplementary Information section 3.1); RE, reduction of error; CE, coefficient of efficiency; Rsq-cal, R-squared in the calibration period; Rsq-ver, R-squared in the verification (evaluation) period. d, Coral data locations relative to source data region (orange box) and Coral Sea region (red box). Coral proxy metadata are given in Supplementary Tables 1 and 2.

