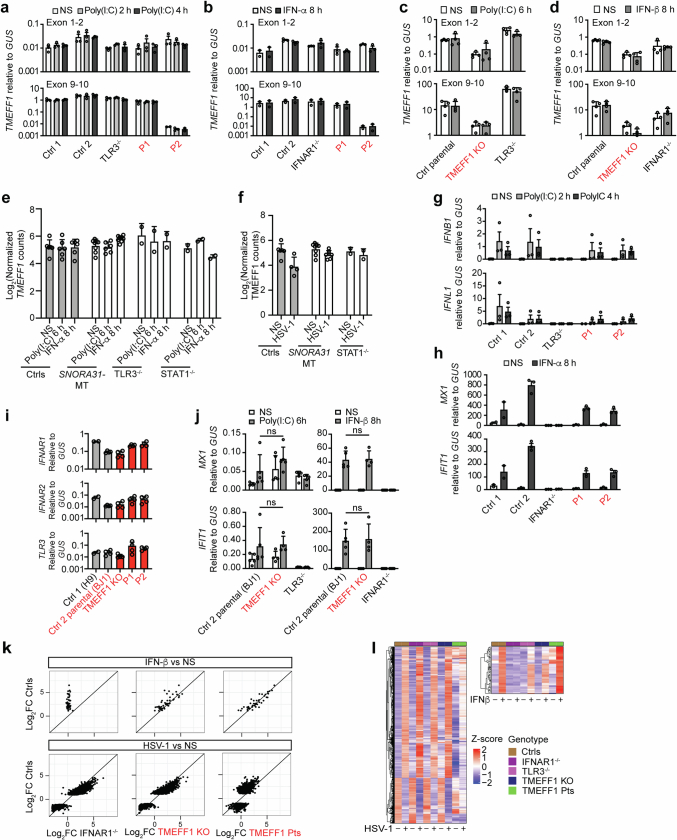
Extended Data Fig. 4. Intact TLR3 and type I IFN responses in TMEFF1-mutated cells.
a, TMEFF1 mRNA levels were determined by RT-qPCR, in SV40-transformed fibroblasts from the patients with TMEFF1 mutations, a TLR3−/− HSE patient, and healthy controls treated with poly(I:C) for 2 or 4 h or left untreated (NS). b, TMEFF1 mRNA levels were measured by RT-qPCR, in SV40-transformed fibroblasts from patients with TMEFF1 mutations, an IFNAR1−/− HSE patient, and healthy controls treated with IFN-α2b for 8 h or left untreated. c, TMEFF1 mRNA levels were measured by RT-qPCR in cortical neurons derived from control parental or TMEFF1 KO hPSCs, and hPSCs from a TLR3−/− HSE patient, after treatment with poly(I:C) for 6 h, or without treatment. d, TMEFF1 mRNA levels were measured by RT-qPCR, in cortical neurons derived from control parental or TMEFF1 KO hPSCs, and hPSCs from an IFNAR1−/− HSE patient treated with IFN-β for 8 h or left untreated. In a-d, two probes, targeting exons 1-2 (upper panels) and exons 9-10 (lower panels) of TMEFF1 were used. The data shown are the means ± SEM from three (a,b) or two (c,d) independent experiments. e, Abundance of TMEFF1 mRNA, as assessed by RNAseq, in healthy control neurons (Ctrls, n = 6), SNORA31-mutated (SNORA31-MT, n = 8), TLR3−/− (n = 2) or STAT1−/− (n = 2) hPSC-derived cortical neurons treated with poly(I:C) or IFN-α2b, or left unstimulated (NS). Data are presented as mean ± SD. f, Abundance of TMEFF1 mRNA, as assessed by RNAseq, in healthy controls (Ctrls, n = 6), SNORA31-mutated (SNORA31-MT, n = 8) or STAT1−/− (n = 2) hPSC-derived cortical neurons infected with HSV-1 for 24 h, or left unstimulated (NS). g, IFNB1 (upper panel) or IFNL1 (lower panel) mRNA levels were measured by RT-qPCR, in SV40-transformed fibroblasts from the patients with TMEFF1 mutations, a TLR3−/− HSE patient, and healthy controls, after treatment with poly(I:C) for 2 or 4 h or without treatment. h, MX1 (upper panel) or IFIT1 (lower panel) mRNA levels were measured by RT-qPCR, in SV40-transformed fibroblasts from the patients with TMEFF1 mutations, an IFNAR1−/− HSE patient, and healthy controls, after treatment with IFN-α2b for 8 h, or without treatment. The data shown in g, and h are the means ± SEM from three independent experiments. i, Basal levels of IFNAR1 (top panel), IFNAR2 (middle panel), and TLR3 (lower panel) mRNA were measured by RT-qPCR, in hPSC-derived cortical neurons from healthy controls (Ctrl 1-H9, Ctrl 2-Parental BJ1), TMEFF1 KO hPSCs, or hPSCs from TMEFF1-mutated patients. j, Levels of MX1 (upper panels) or IFIT1 (lower panels) mRNA were measured by RT-qPCR, in cortical neurons derived from control parental or TMEFF1 KO hPSCs, hPSCs from a TLR3−/− HSE patient, and an IFNAR1−/− HSE patient, with and without treatment with poly(I:C) for 6 h (left panels), or with IFN-β for 8 h (right panels). Statistical analysis was performed with two-tailed Mann-Whitney U tests. ns: not significant. k, Scatterplots of the mean log2 fold-changes in RNAseq-quantified gene induction following stimulation with 100 IU/ml IFN-β for 8 h (upper panel) or HSV-1 (MOI 1) for 24 h (lower panel) in hPSC-derived CNS cortical neurons from two healthy controls (Ctrl1-H9, Ctrl2 parental-BJ1), TMEFF1-mutated patients (TMEFF1 Pts) or TMEFF1 KO hPSCS, or hPSCs from an IFNAR1−/− HSE patient. Each point represents a single gene. Genes with an absolute fold-change in expression > 2 in response to IFN-β or HSV-1 treatment relative to NS samples in the Ctrl group are plotted. l, Heatmaps of RNA-Seq-quantified gene expression (z-score-scaled DESeq2 vst-normalization) in hPSC-derived CNS cortical neurons from healthy controls (Ctrl 1-H9, Ctrl 2-Parental BJ1) or TMEFF1 KO hPSCS, or hPSCs from an IFNAR1−/− HSE patient, a TLR3−/− HSE patient and TMEFF1-mutated P1 and P2 (TMEFF1 Pts), not stimulated (NS), stimulated with HSV-1 for 24 h, or stimulated with IFN-β for 8 h. Duplicates were studied for each set of conditions and mean gene expression levels were used for subsequent analyses. The heatmap includes genes with a relative fold-change in expression > 2 in response to HSV-1 or IFN-β treatment relative to NS samples in the Ctrl group.

