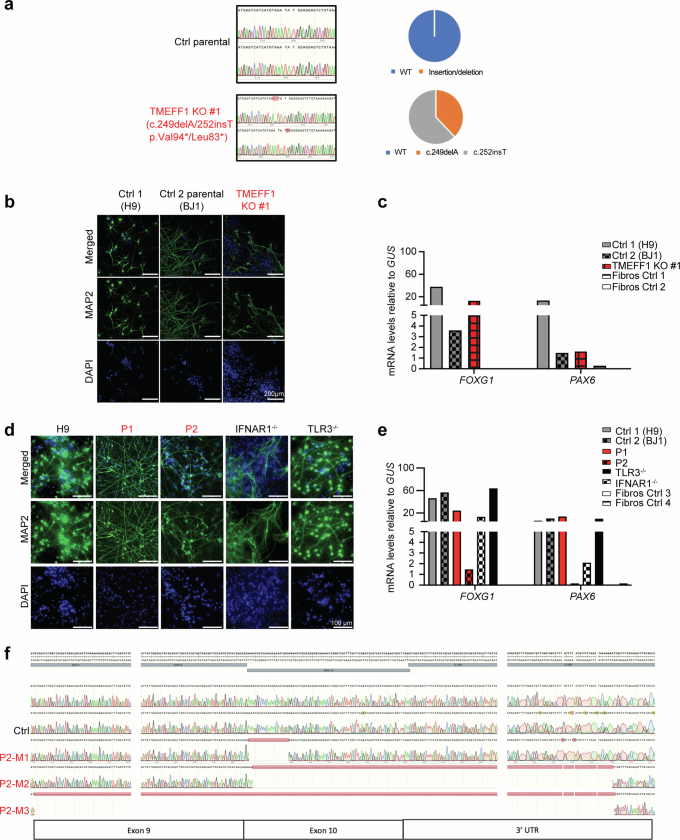
Extended Data Fig. 3. Characterization of hPSC-derived CNS cortical neurons.
a, Electropherogram representation (left panels) of the CRISPR-Cas9-introduced compound-heterozygous TMEFF1 mutations confirmed by Sanger sequencing on genomic DNA from a gene-edited TMEFF1 KO hPSC line (TMEFF1 KO #1). Sequencing results for the parental line (Ctrl parental, BJ1) are also shown. The relative abundance of WT or mutated TMEFF1 cDNA generated from mRNA extracted from the control parental and TMEFF1 KO hPSCs was assessed by TOPO-TA cloning and is shown in the right panels. b, Representative images of cortical neurons from controls (Ctrl 1-H9, Ctrl 2 parental-BJ1) and TMEFF1 KO hPSCs. Cells were fixed and stained with DAPI (blue) and for a neuron-specific marker, microtubule-associated protein 2 (MAP2, green). c, FOXG1 and PAX6 mRNA levels, as measured by RT-qPCR, in cortical neurons from control and TMEFF1 KO hPSCs. SV40-transformed fibroblasts from healthy controls (Fibros ctrl 1, Fibros ctrl 2) were used as a negative control in this assay. d, Representative images of cortical neurons from control (H9) and various patient-specific hPSC lines (P1, P2, IFNAR1−/−, TLR3−/−). Cells were fixed and stained with DAPI (blue), and for a neuron-specific marker MAP2 (green). e, FOXG1 and PAX6 mRNA levels were measured by RT-qPCR in cortical neurons derived from control and patient-specific hPSC lines. SV40-transformed fibroblasts from healthy controls (Fibros ctrl 3, Fibros ctrl 4) were used as a negative control in this assay. f, Electropherogram representation of the three TMEFF1 mutant isoforms, as detected by TOPO-cloning of cDNA from P2’s hPSC-derived cortical neurons.

