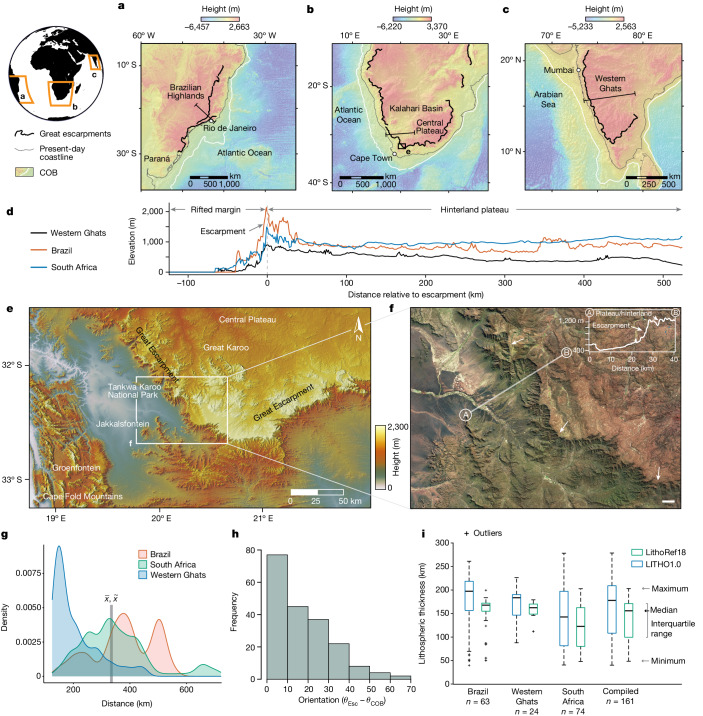
Fig. 1. Location and physical characteristics of great escarpments.
Global terrain maps for ocean and land (gridded data from GEBCO) of the east coast of Brazil (a), Southern Africa (b) and the Western Ghats (Sahyadri Hills), India (c) (see inset map for locations). The maps show a simplified representation of escarpments mapped using digital terrain models (Methods) and COBs from GPlates59 (https://www.gplates.org/). d, Topographic profiles of escarpments (see a–c for lines of section). e, Map of the Great Escarpment of South Africa (see b for location) generated using NASA SRTM elevation data (Lambert conformal conic projection). f, Short-wave infrared satellite image of the same escarpment (white arrows) from Sentinel Hub. A typical topographic profile is shown (A–B). Sinuosity of escarpments is related to contrasted retreat rates of channels relative to interfluves1. Scale bar, 5 km. g, Probability density for nearest distance between escarpments and COBs for the regions (see a–c). Global mean and median thicknesses (vertical grey band) are 336 and 333 km, respectively (n = 5,288; Extended Data Fig. 3a–c). Two distinct peaks for Brazil reflect two phases of escarpment formation there (Cretaceous and Cenozoic)3. h, Difference in orientation between escarpments (θEsc) and COBs (θCOB) calculated using the perpendicular to the escarpment tangent at 50-km intervals (n = 195; Methods and Extended Data Fig. 2). Escarpments are typically sub-parallel to adjacent COBs (Extended Data Fig. 3d–g). i, Box plot of lithospheric thickness for each escarpment, point sampled from maps generated using LITHO1.0 (ref. 41) (blue boxes) and LithoRef18 (ref. 42) (green boxes) at 1.0°, or approximately 111-km, intervals (n = 161).

