
Fig. 3. Exhumation of the Central Plateau of Southern Africa through time.
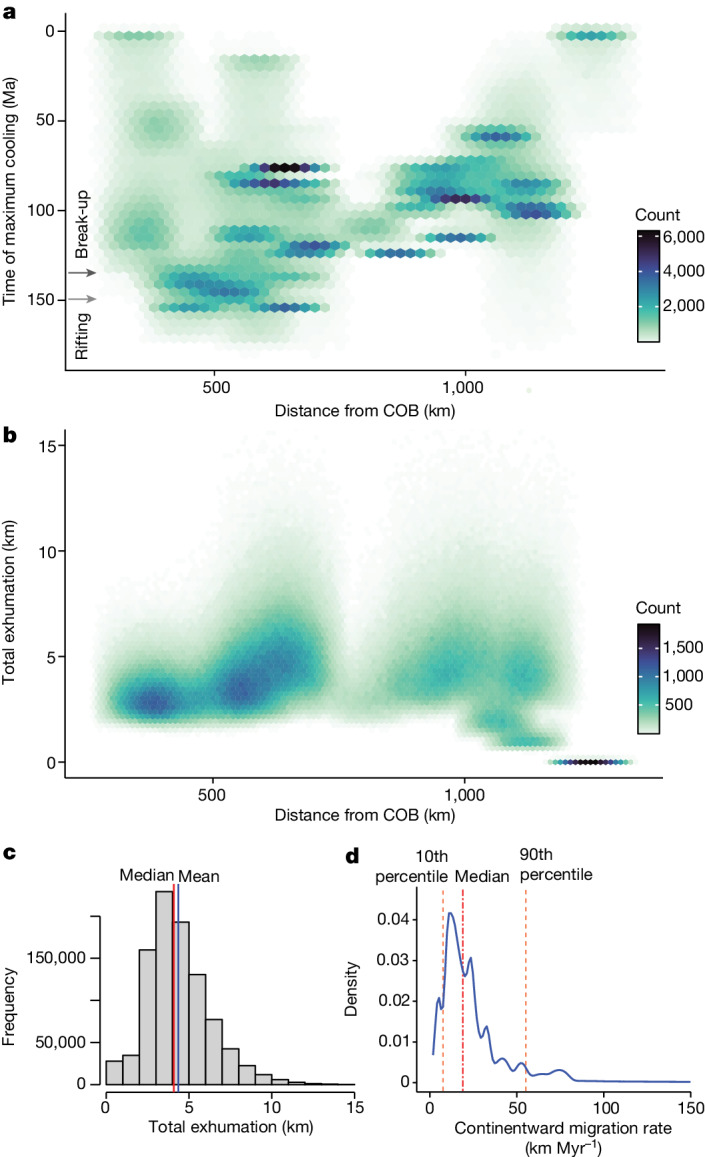
a, Hexagonal heat map showing the statistically defined times of maximum temperature drop () from thermochronology at 47 sites across the plateau (Extended Data Table 3). This plot was generated using Monte Carlo sampling (20,000 samples per site) of the estimated time and distance uncertainty at each site (see Methods and Extended Data Fig. 8b). b, Hexagonal heat map showing the estimated total exhumation for each site (47 sites, 20,000 samples per site) from 180 to 0 Ma using best-fit thermal history models and accounting for uncertainties in distance and geothermal gradient (see Methods and Extended Data Fig. 8c). c, Histogram of sampled total exhumation (n = 940,000), with mean and median values of 4.35 and 4.06 km, respectively. d, Density plot showing the apparent continentward migration rates of maximum cooling at thermochronology sites (n = 784,659 samples, or 87% out of 940,000; that is, post-break-up cases only) relative to the timing of continental break-up at the South Atlantic COB (135 Ma)54. The median rate is 19.1 km Myr−1 and the 10th and 90th percentiles are 7.7 and 55.2 km Myr−1, respectively.