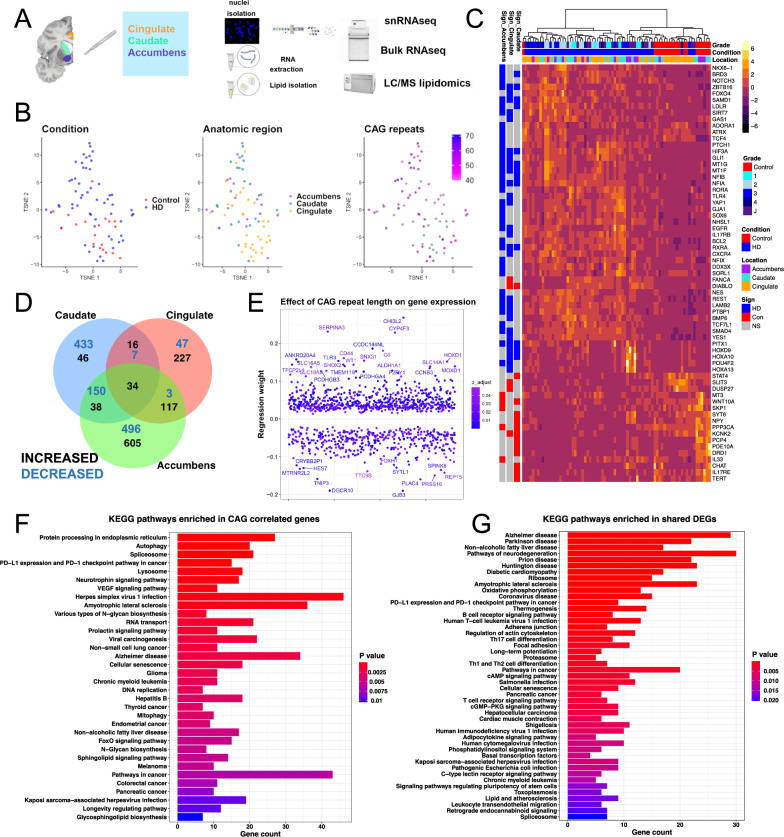
Fig. 1. Transcriptomic analysis of HD identifies cross-regional and CAG-correlated gene signatures.
A Schematic depicting experimental plan. B t-distributed stochastic neighbor (t-SNE) embedding of bulk RNAseq samples used in the study color-coded by condition (left), anatomic region (middle), and CAG repeat length (right). Control samples and ones with no available CAG repeat lengths are shown in grey. C Heatmap of normalized gene expression showing a select subset of differentially expressed genes (DEGs). The DEGs (rows) are color-coded on the right by the direction of differential expression in the specified region (left columns). DEGs Increased in Control: red, DEGs increased in HD: blue, non-significant (NS) genes – grey. The samples (Columns) are also color-coded by HD grade/Condition (Con: Control, HD1–4: 1–4, J: Juvenile onset HD) and anatomic region (top horizontal bars). D Venn diagram showing the overlap between DEGs with FDR-adjusted p value < 0.05 across the three anatomic regions. The numbers of increased – black, and decreased – blue, genes are indicated. E Scatter plot showing genes with significant regression weights for CAG repeat length (y-axis). The order of genes on the x-axis is arbitrary. Color indicates Benjamini–Hochberg adjusted p value. Genes with coefficients two standard deviations above the mean are indicated. F–G EnrichR barplots of KEGG pathways enriched in genes that positively or negatively correlate with CAG repeat length (F) or in DEGs that are shared across two or three anatomic regions (increased and decreased—G). Gene count is indicated on the y-axis. Color indicates Benjamini–Hochberg adjusted p value. A was created with BioRender.com released under a Creative Commons Attribution-NonCommercial-NoDerivs 4.0 International license.

