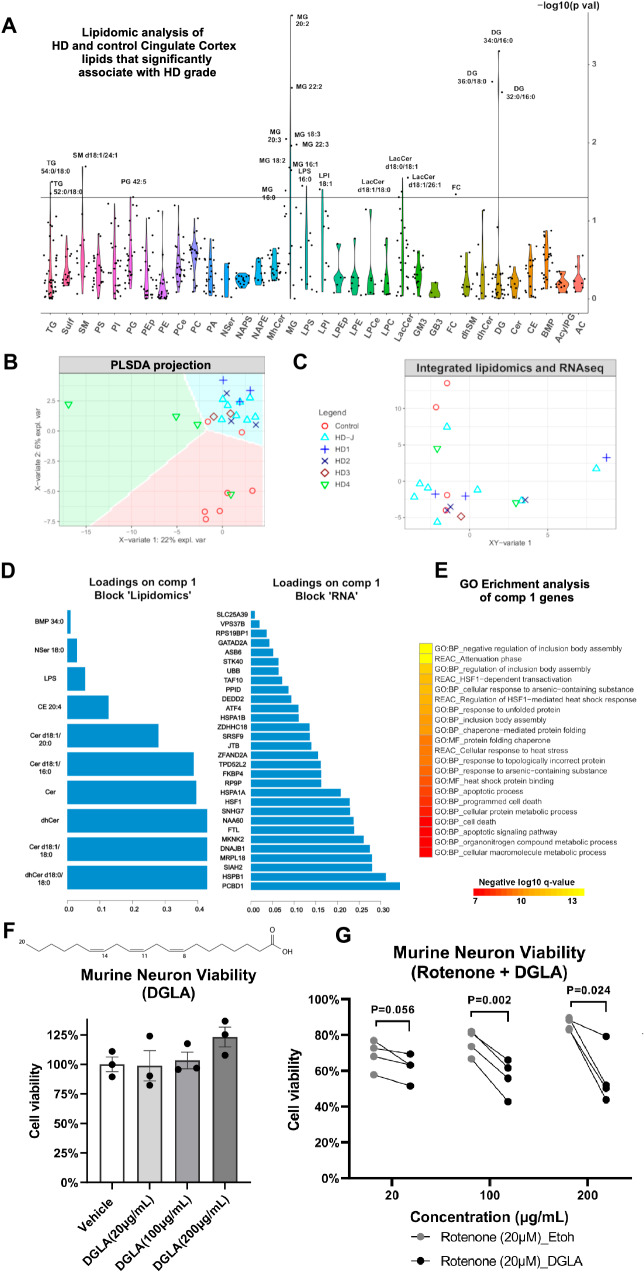
Fig. 2. Lipidomic analysis of HD cingulate cortex.
A Violin plot of the −log10 of the ANOVA p values (y-axis) of lipid species (x-axis) that correlate with HD grade – see related Fig. S3A for direct comparisons between HD and controls, and Supplementary Dataset-4 for abbreviations. B Scatter plot showing the projection of brain samples analyzed by lipidomics in the first two latent variables of the sparse-partial least squares (sPLS) discriminant analysis model. The variance explained by each latent variable is indicated on the axes. The samples are color- and shape-coded by condition/grade. The condition can be predicted to a high degree of accuracy in the colored background regions - see related Fig. S3B. C Integration of lipidomics data and matched bulk RNAseq data generated from adjacent samples of the same brain region using sparse projection to latent space analysis. The samples are color- and shape-coded as per B and projected in the combined integrated space. D Barplots showing the loadings of the lipid species (left) and RNA transcripts (right) in the first sparse projection to latent space variable that predicts grade. E Gene ontology enrichment analysis of component 1 genes (from D). Negative log10 of the adjusted p values are indicated. P value adjustment was done in gprofiler using the g:SCS method. F Quantification of the percentage of viable murine neurons treated for 24 h with the indicated concentrations of di-homo gamma lenolenic acid (DGLA), a poly-unsaturated fatty acid increased in HD. Illustration of the structure of DGLA is indicated on the top. N = 3 experiments. Unpaired two-tailed test. P values = 0.936 for 20 µg/ml vs vehicle, p = 0.746 for 100 µg/ml vs vehicle and p = 0.091 for 200 µg/ml vs vehicle. Data are shown as mean ± SEM. G Quantification of the viability of murine neurons co-treated with 20 µM Rotenone and the indicated concentrations of DGLA (black dots) or Ethanol (grey dots). N = 4 experiments. Paired two-tailed t-test. P = 0.056 for 20 µg/ml, p = 0.002 for 100 µg/ml and p = 0.024 for 200 µg/ml.

