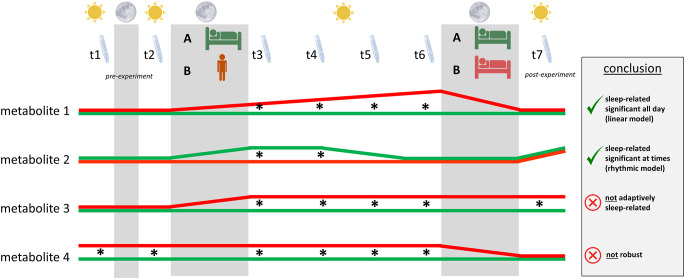
Fig. 2.
Theoretical profiles of fictitious metabolites. Sun icon indicates biological day, moon icon and gray fields indicate biological nighttime. t1-t7 and Salivette® devices highlight necessary sampling time points of which t1 and t2 should be before the experimental night, and t7 after recovery night. Group A represents the control condition that offers sleep in both the second (experimental night) and the third biological night (recovery). Group B represents the sleep deprivation condition, which is kept awake during the experimental night but allows recovery sleep in the following night. Theoretically expected levels of four different metabolite types are portrayed in either green or red lines for the different conditions A and B, respectively. Asterisks indicate sampling time points when a statistical analysis results in a significant difference between the two metabolite levels. Metabolite 1 mimics a sleep-related metabolite following a linear model as the changes in metabolite levels occur during experimental night, increase linearly during the following daytime, and recede after recovery night. Likewise, metabolite 2 is sleep-related, as changes occur during the experimental night but can only be detected at sampling time points t3 and t4. This holds true for metabolites that are influenced by daily rhythm patterns under natural conditions (i.e., rhythmic model). Levels of metabolite 3 do not align after recovery night and can therefore not be related to adaptive sleep-wake regulation. Metabolite 4 shows significant differences between the two conditions even before the experiment starts and can thus not be reliably used for such studies

