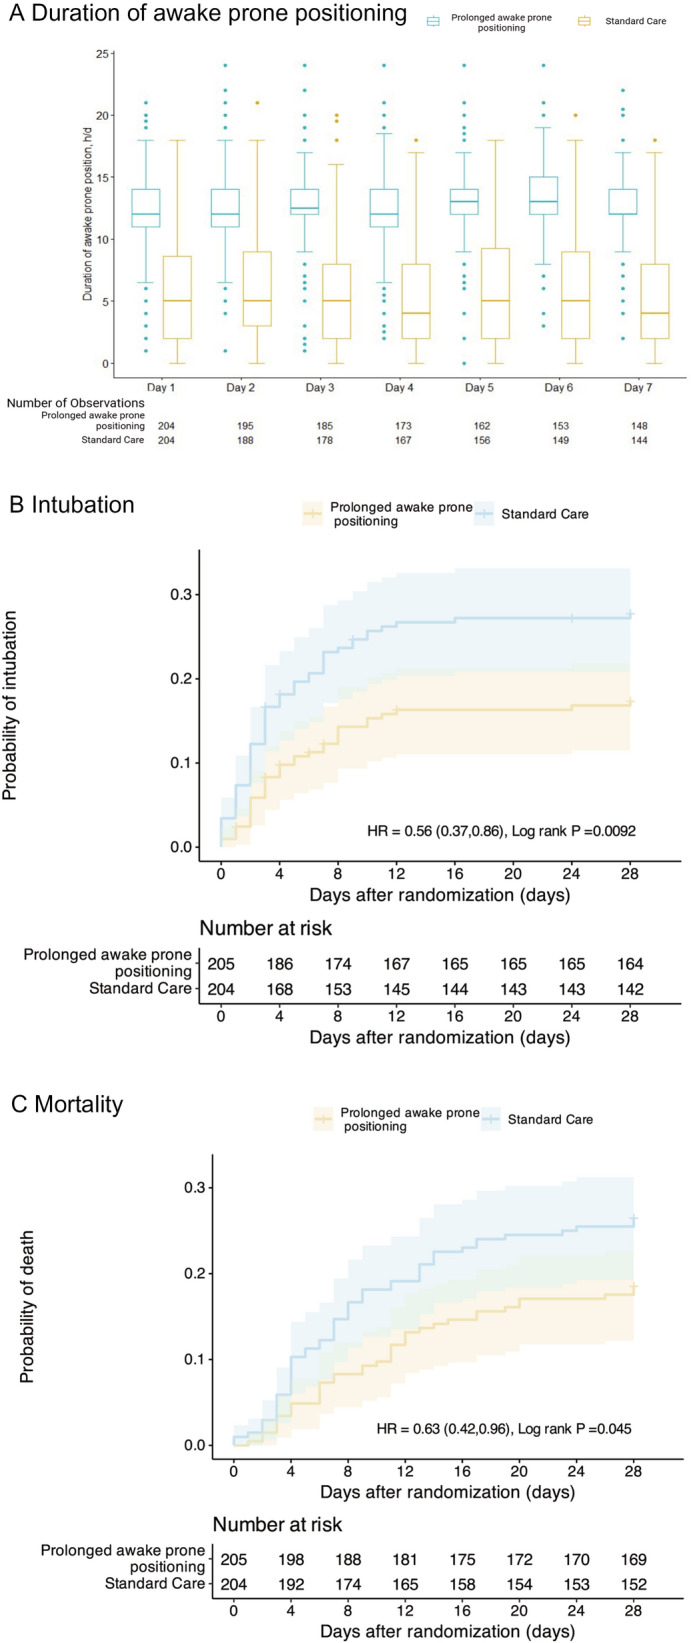
Fig. 2.

Duration of Awake Prone Positioning and Kaplan–Meier probabilities estimates in the intention-to-treat population. A The box plots display the median durations of prone positioning. The lines represent the median, the box edges represent the first and third quartiles, the whiskers represent the most extreme values up to 1.5 × IQR, and the dots represent the more extreme values. B Probability of endotracheal intubation*. The log-rank test demonstrated a significant between-group difference (P = 0.0092). *Patients who refused intubation after randomization were included as NOT being intubated. C Probability of death. The log-rank test demonstrated a significant between-group difference (P = 0.045)
