
Fig. 5.
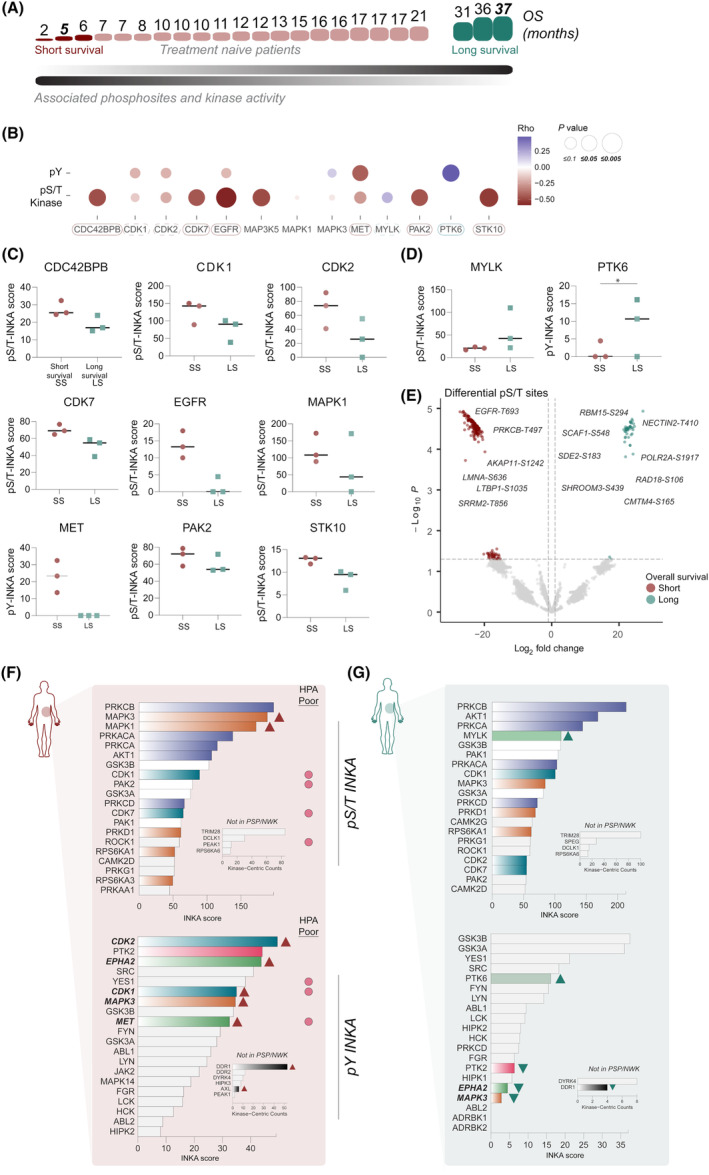
Kinase activity in short and long survival (treatment naïve) patients. (A) Spearman correlation of phosphorylated serine and threonine (pS/T)‐based Integrative iNferred Kinase Activity (INKA) kinases. (B) Overview of Spearman correlation coefficients and P values between INKA kinases at phosphotyrosine (pY) and pS/T level and overall survival in treatment naïve patient subset. Boxes suggest kinase relevance in prognosis outcomes. (C) Elevated INKA scores of pS/T and pY‐based kinases in short survival (SS) patients. Short and long survival groups were defined with patients with opposing outcomes. (D) Elevated INKA scores of pS/T and pY‐based kinases in long survival (LS) patients. *P = 0.0406, significance performed using Mann–Whitney test. (E) Volcano plot representing differential pS/T sites between poor and better survival patients (3 vs 3) with fold change two and P ≤ 0.05. Two‐group comparison was performed using unpaired t‐test in limma statistics. See also Table S10. (F) pS/T and pY‐based INKA profile of poor survival patient (overall survival, OS = 5 months). Significant poor prognostic markers by Human Protein Atlas (HPA) were annotated. (G) pS/T and pY‐based INKA profile of long survival patient (OS = 37 months). For both patients, kinase‐centric counts of kinases with no kinase‐substrate relations in PSP/NWK are also displayed. INKA kinases were colored to pinpoint common members of signaling pathways and to highlight the differences between patients.