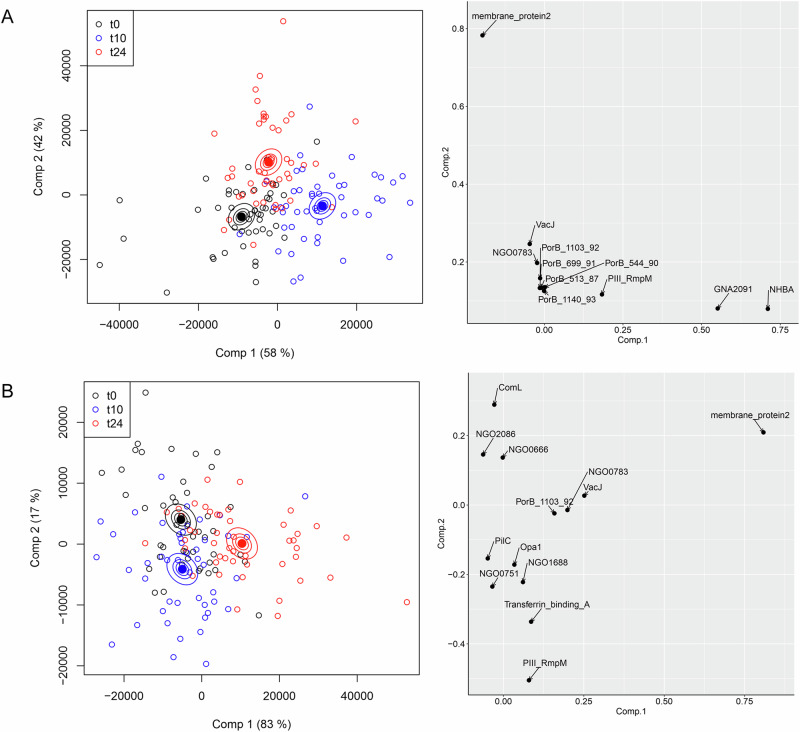
Fig. 2. ASCA separation of IgA antibody profiles by vaccine recipient.
In the left-hand panels, each point represents a profile derived from IgA reactivity against antigens across the array. Comp 1 and Comp 2 represent the first and second principal components in the ASCA analysis. Confidence ellipsoids are plotted that reflect the estimated variation of the effect level means at 40, 68 and 95%22. Open symbols represent individual serum samples; ellipsoid centres are plotted as filled symbols. Righthand panels show the antigens with the highest loadings for each component. A ASCA calculation with all antigens included. B As (A) but without the recombinant antigens, NHBA, fHbp, GNA2091 and GNA1030.

