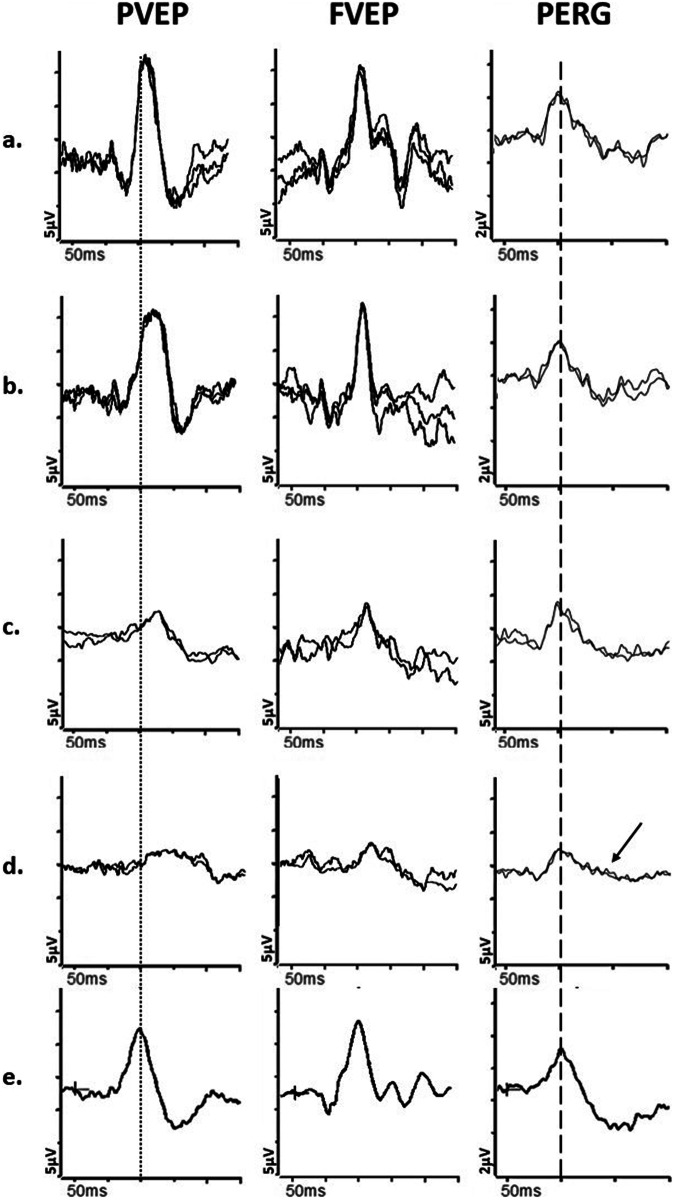
Fig. 4. Electrophysiological findings in cases of optic nerve demyelination.
Examples of pattern reversal VEPs (PVEP), flash VEPs (FVEP) and pattern ERGs (PERG) from a and b, a patient with demyelination in the one eye; (c and d), a patient with demyelination in the left eye and sub-clinical involvement of the right eye; e from a representative normal subject for comparison. All patient traces are superimposed to demonstrate reproducibility. Peak time differences are highlighted by the vertical dotted line (PVEP P100) and vertical dashed line (PERG P50). The first patient, with demyelination in the left eye (b) has a PVEP P100 of mildly delayed peak time and normal amplitude, consistent with mild optic nerve conduction delay. The flash VEP is normal. The PERG N95:P50 ratio, P50 peak time and amplitude are normal. The asymptomatic right eye (a) shows normal PVEP, FVEP and PERG. The second patient’s left eye (d) shows a PVEP P100 of markedly delayed peak time and subnormal amplitude, consistent with severe optic nerve conduction delay. Additionally, the FVEP is moderately subnormal and mildly delayed. There is severe PERG N95:P50 ratio reduction (arrow), consistent with severe retinal ganglion cell dysfunction; P50 peak time is normal. The asymptomatic right eye (c) shows a PVEP P100 of moderately delayed peak time and subnormal amplitude, consistent with mild to moderate optic nerve conduction delay and sub-clinical involvement. The right eye PERG is normal.

