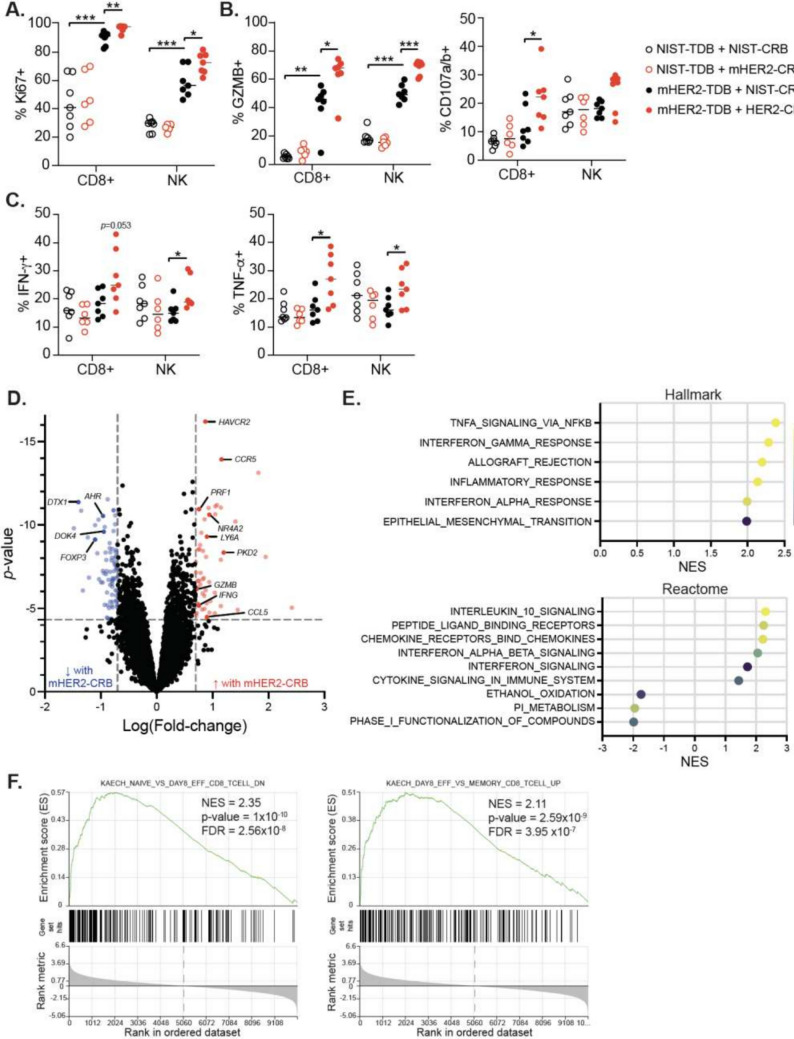
Fig. 6.
HER2-CRB promotes NK cell and CD8 + T cell effector function in vivo. Fo5 tumor-bearing mice were treated with NIST- or mHER2-TDB with NIST- or mHER2-CRB. Tumors were harvested 4 days following treatment for analysis. A Frequency of Ki67 + CD8 + T and NK cells. B Percent Granzyme B + and CD107a/b + CD8 + T and NK cells. C Percentages of IFN-γ + and TNF-α + CD8 + T and NK cells. D Differential gene expression analysis of bulk RNA-seq from sorted CD8 + TILs. Blue dots represent Log(fold-change) of ≤ − 0.7 and red dots depict Log(fold-change) ≥ 0.7, p ≤ 0.05. Black points are below stated thresholds. (E) GSEA data from Hallmark (top) and Reactome (bottom) gene sets from results in (D). F GSEA from immunologic gene sets (C7) from data in (D). Mann–Whitney test used for statistical analysis; *, p ≤ 0.05; **, p ≤ 0.01; ***, p ≤ 0.001

