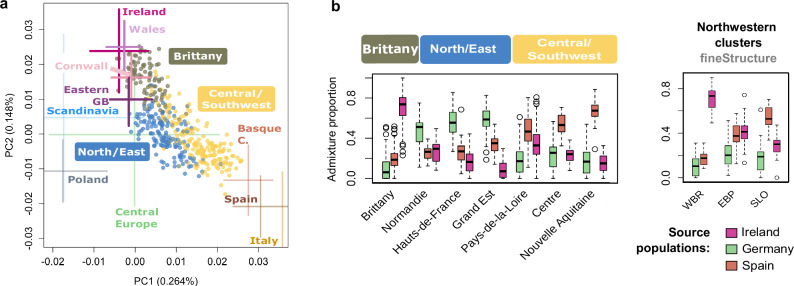
Fig. 3. PCA and supervised admixture analysis of present-day western Europeans.
a The two first principal components of genetic variation in the “modern merged dataset”, which includes 843 French WGSs for which the four grand-parent origin was concordant, and genome-wide data from 20 central and western European populations42,43(population acronyms below, see Methods for further details). To avoid bias due to sample size differences among regions, all locations are represented by a maximum of 100 individuals resulting in a total of 2070 samples and 201,999 independent SNPs (MAF > 4%). For simpler visualisation samples from Norway, Sweden, and Denmark were labelled as “Scandinavia”, samples from Belgium and Germany were labelled as “Central Europe”. FranceGenRef samples are represented by dots and labelled with boxes while non-French samples are represented by 2*sd of the two PCs. UK samples other than those from the POBI dataset, whose origin of the grandparents is known, are not shown. Similarly, French samples from public datasets are also not shown. To better visualise the distribution of our samples the plot is a zoom of the full PCA (Fig. S20). b Ancestry proportions retrieved from a Supervised Admixture analysis considering Ireland, Spain, and Germany as proxy source populations on the basis of their polarised positions relative to the distribution of the 843 French samples on (a). In the boxplot the central mark and edges indicate the 50th (median), 25th and 75th percentiles. Whiskers encompass the largest or smallest point comprised within 1.5× of the interquartile range from both edges.

