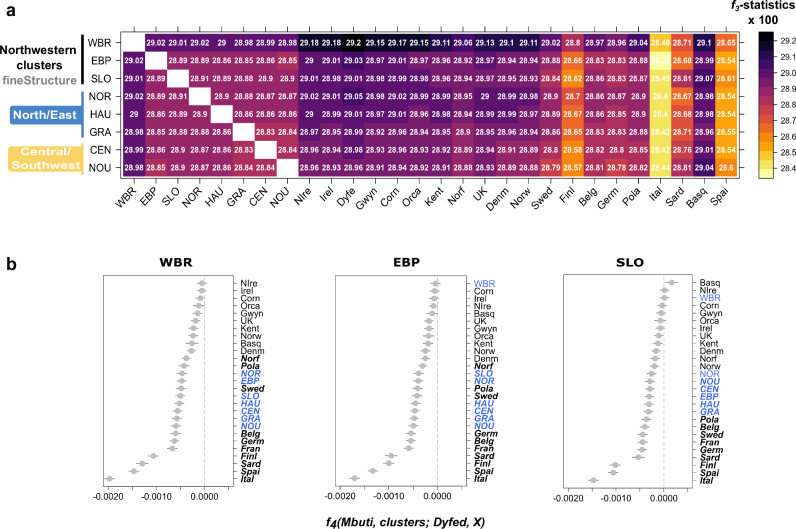
Fig. 4. Genetic affinities between Brittany and Ireland/West British Isles from f-statistics.
a Heatmap reporting outgroup f3-statistics in the form f3(Mbuti; French population/cluster, X), where French population/cluster is represented on the y-axis and X on the x-axis. b f4-statistics of the form f4(Mbuti, French cluster; Dyfed, X), where X are the populations on the right side of the plot. Due to disparities in samples sizes, both the outgroup f3- and f4-statistics were computed on a n = 25 samples/population, excepting for the Mbuti (n = 10), Basque (n = 20), Normandy (n = 19) and the Orcadians (n = 13). In bold are represented f4-statistics values with a corresponding |Z | > 3 and ranges correspond the standard deviation (sd) from weighted block jackknife. Cluster acronyms: western Brittany (WBR), eastern Brittany and Pays-de-la-Loire (EBP), south Loire (SLO). Region/country acronyms: Brittany (BRI); Pays-de-la-Loire (PAY); Normandie (NOR); Hauts-de-France (HAU); Grand Est (GRA); Centre-Val de Loire (CEN); Nouvelle-Aquitaine (NOU), Basque Country (Basq), Belgium (Belg), Cornwall (Corn), Denmark (Denm), Dyfed (Dyfe), Finland (Finl), Germany (Germ), Gwynedd (Gwyn), Ireland (Irel), Italy (Ital), Kent (Kent), Norfolk (Norf), Northern Ireland (NIrel), Norway (Norw), Orkney Islands (Orca), Poland (Pola), Sardinia (Sard), Spain (Spai), Sweden (Swed), United Kingdom (UK). Plots were generated with the R statistical package89 and the heatmap with the library lattice.

