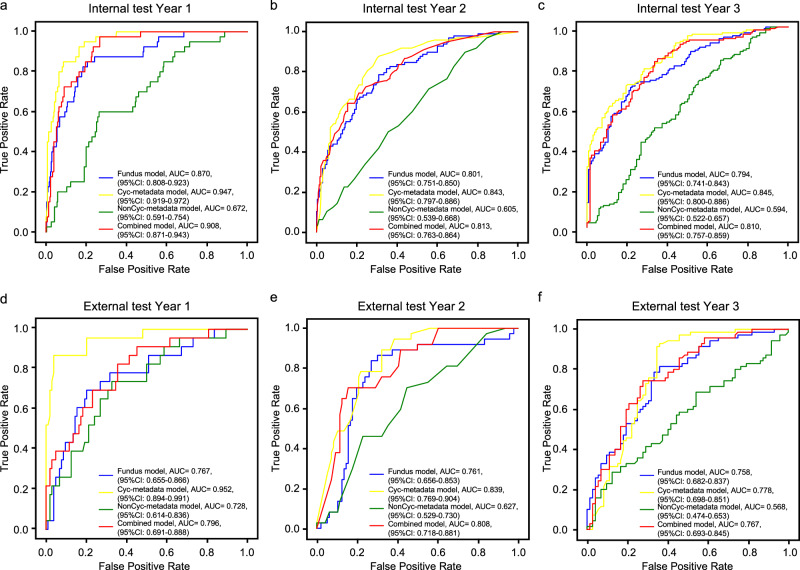
Fig. 2. Performance of four models to predict myopia onset at various time points.
The receiver operating characteristic (ROC) curves with the areas under the curve (AUCs) to depict the predictive performance for myopia onset across years 1 to 3. Year 1 (a), year 2 (b), year 3 (c) in the internal test set and in the external test set for year 1 (d), year 2 (e), year 3 (f). The fundus model utilized fundus images as input, while Cyc-metadata model incorporated age, sex, and SE from cycloplegic exams. NonCyc-metadata model included age, sex, and AL from non-cycloplegic examinations. The combined model integrated fundus images, age, sex, and AL.

