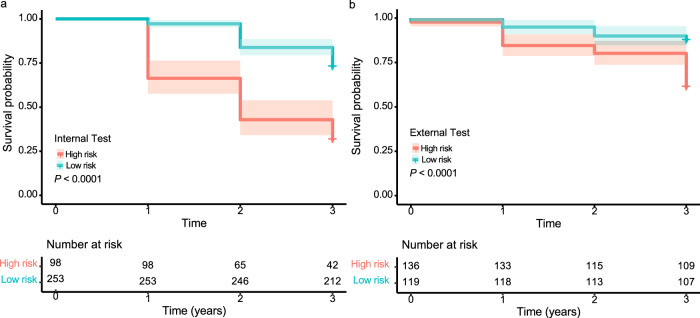
Fig. 3. Kaplan–Meier plots to predict myopia onset according to risk stratification.
Red and blue curves represent the survival probabilities of high and low risk groups respectively, and shaded areas represent 95% confidence intervals (CI). The number of individuals at risk at each time point is presented. The survival probability of DeepMyopia not becoming myopic in the internal longitudinal test set (a) and external longitudinal test set (b) over time progression. Statistical significance was tested using log-rank tests.

