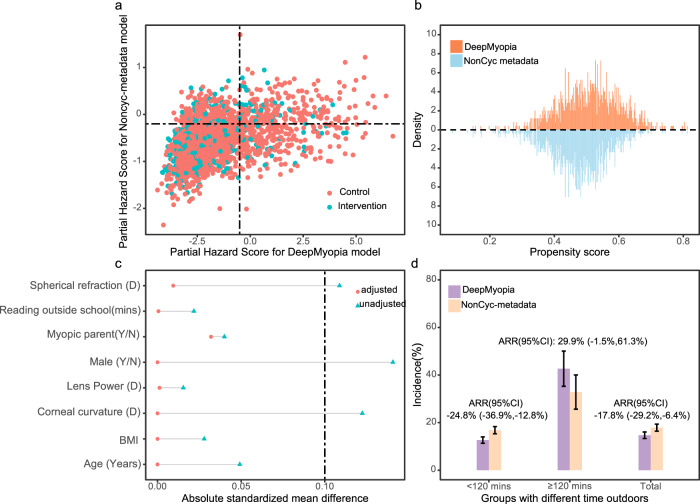
Fig. 4. Emulating randomized controlled trial for DeepMyopia-assisted Intervention.
a The distribution of the partial hazard score over the control (orange) and the intervention (blue) groups, with the DeepMyopia in the horizontal axis and the NonCyc-metadata model in the vertical axis. b The distribution of estimated propensity scores over the DeepMyopia (orange) and the NonCyc-metadata model (blue), with the DeepMyopia above the dashed line and the NonCyc-metadata model below the dashed line. c The standardized mean differences (SMD) of the top eight well-balanced covariates. The dashed line indicates the threshold of balancing. d Incidence of myopia and adjusted relative reduction of myopia incidence within subgroups with different time outdoors between the DeepMyopia (purple) and NonCyc-metadata model (pink). The error bars represent 95% confidence intervals (CI).

